1
Art Meets Data: Enhancing Creative Capital's impact through analytics-driven insights for optimized digital Reach and Engagement
Overview
Our team analyzed Creative Capital's digital analytics data & provided recommendations to improve their content strategy and expand their digital reach to both artists and donors.
Creative Capital, a non-profit grant-making organization, funds artists for innovative work, amplifies their impact, and supports artistic careers. The focus spans artists, grantees, applicants, supporters, and the arts industry. We aimed to understand digital audience interaction and content reach, improving strategy for artists and donors. Recommendations stemmed from Google Analytics, Instagram Analytics, and Supermetrics were presented in a Looker Studio dashboard for year-to-year tracking.
Attended client meetings, extracted Instagram data using Supermetrics tool, analyzed and made the Instagram Dashboard on Looker studio. Also contributed in making the Digital Analytics report and Presentation wherein I worked on one of the findings, recommendations, overview and methodology.
My Role
Key Takeaways
Traffic to Specific Support Pages: We observed relatively low traffic (2,000 visits in the last year) to support pages. The site's search feature seemed to work against itself due to similar language on other pages. We recommended the consistent use of 'Donate' across pages to enhance findability.
Digital Analytics Case study
for
CLIENT Creative Capital
TIMELINE 6 Weeks
TEAM Chelsea Yip Priyanka Jain Stacey O’Carroll Tereza Chanaki Zixuan Zhao
MY ROLE UX Designer & Researcher
TOOLS USED Google Analytics Instagram Analytics. Super-metrics Looker studio
2
Tracking Key Events: As the team worked through the data, we realized the importance of tracking key events. We suggested tracking newsletter signups as Google Analytics events to gain insights into user journeys without relying on third-party platforms.
3
Social Media Strategy: Creative Capital's social media showed strong engagement (21% per post). To attract more donors, we advised creating more content - such as carousels showcasing artists' work and encouraging donations. We found that timely themed posts tended to increase engagement and outreach.
Building a Stronger Foundation: Creative Capital's Focus on Digital Growth
As a nonprofit supporting artists, Creative Capital prioritizes a strong online presence for outreach and donor engagement. We focused on Instagram and website traffic to boost visibility. Discussions with Aliza Sena and Priya Gandhi highlighted key areas: donor/support pages and email sign-ups. Data collected from March 2022 to March 2023, including grant open calls, has expanded our digital footprint, engaging donors, and supporting artists.

Limitations
Our Goals
Limitations include not addressing traffic to the Creative Capital Curriculum or conducting an SEO audit due to low priority per discussions. Analyzing traffic to the Donate page posed a challenge due to separate GA accounts for donate.creative-capital.org and creative-capital.org. The third-party platform Classy manages the Donate page, complicating GA account merging. These areas could be explored in future projects; the focus remains on current goals. Tracking Instagram follower growth rate was hindered by the absence of a specific Supermetrics metric. To address this, we manually integrated client-provided follower counts into Looker Studio for visualization.
Social Media Analytics

+

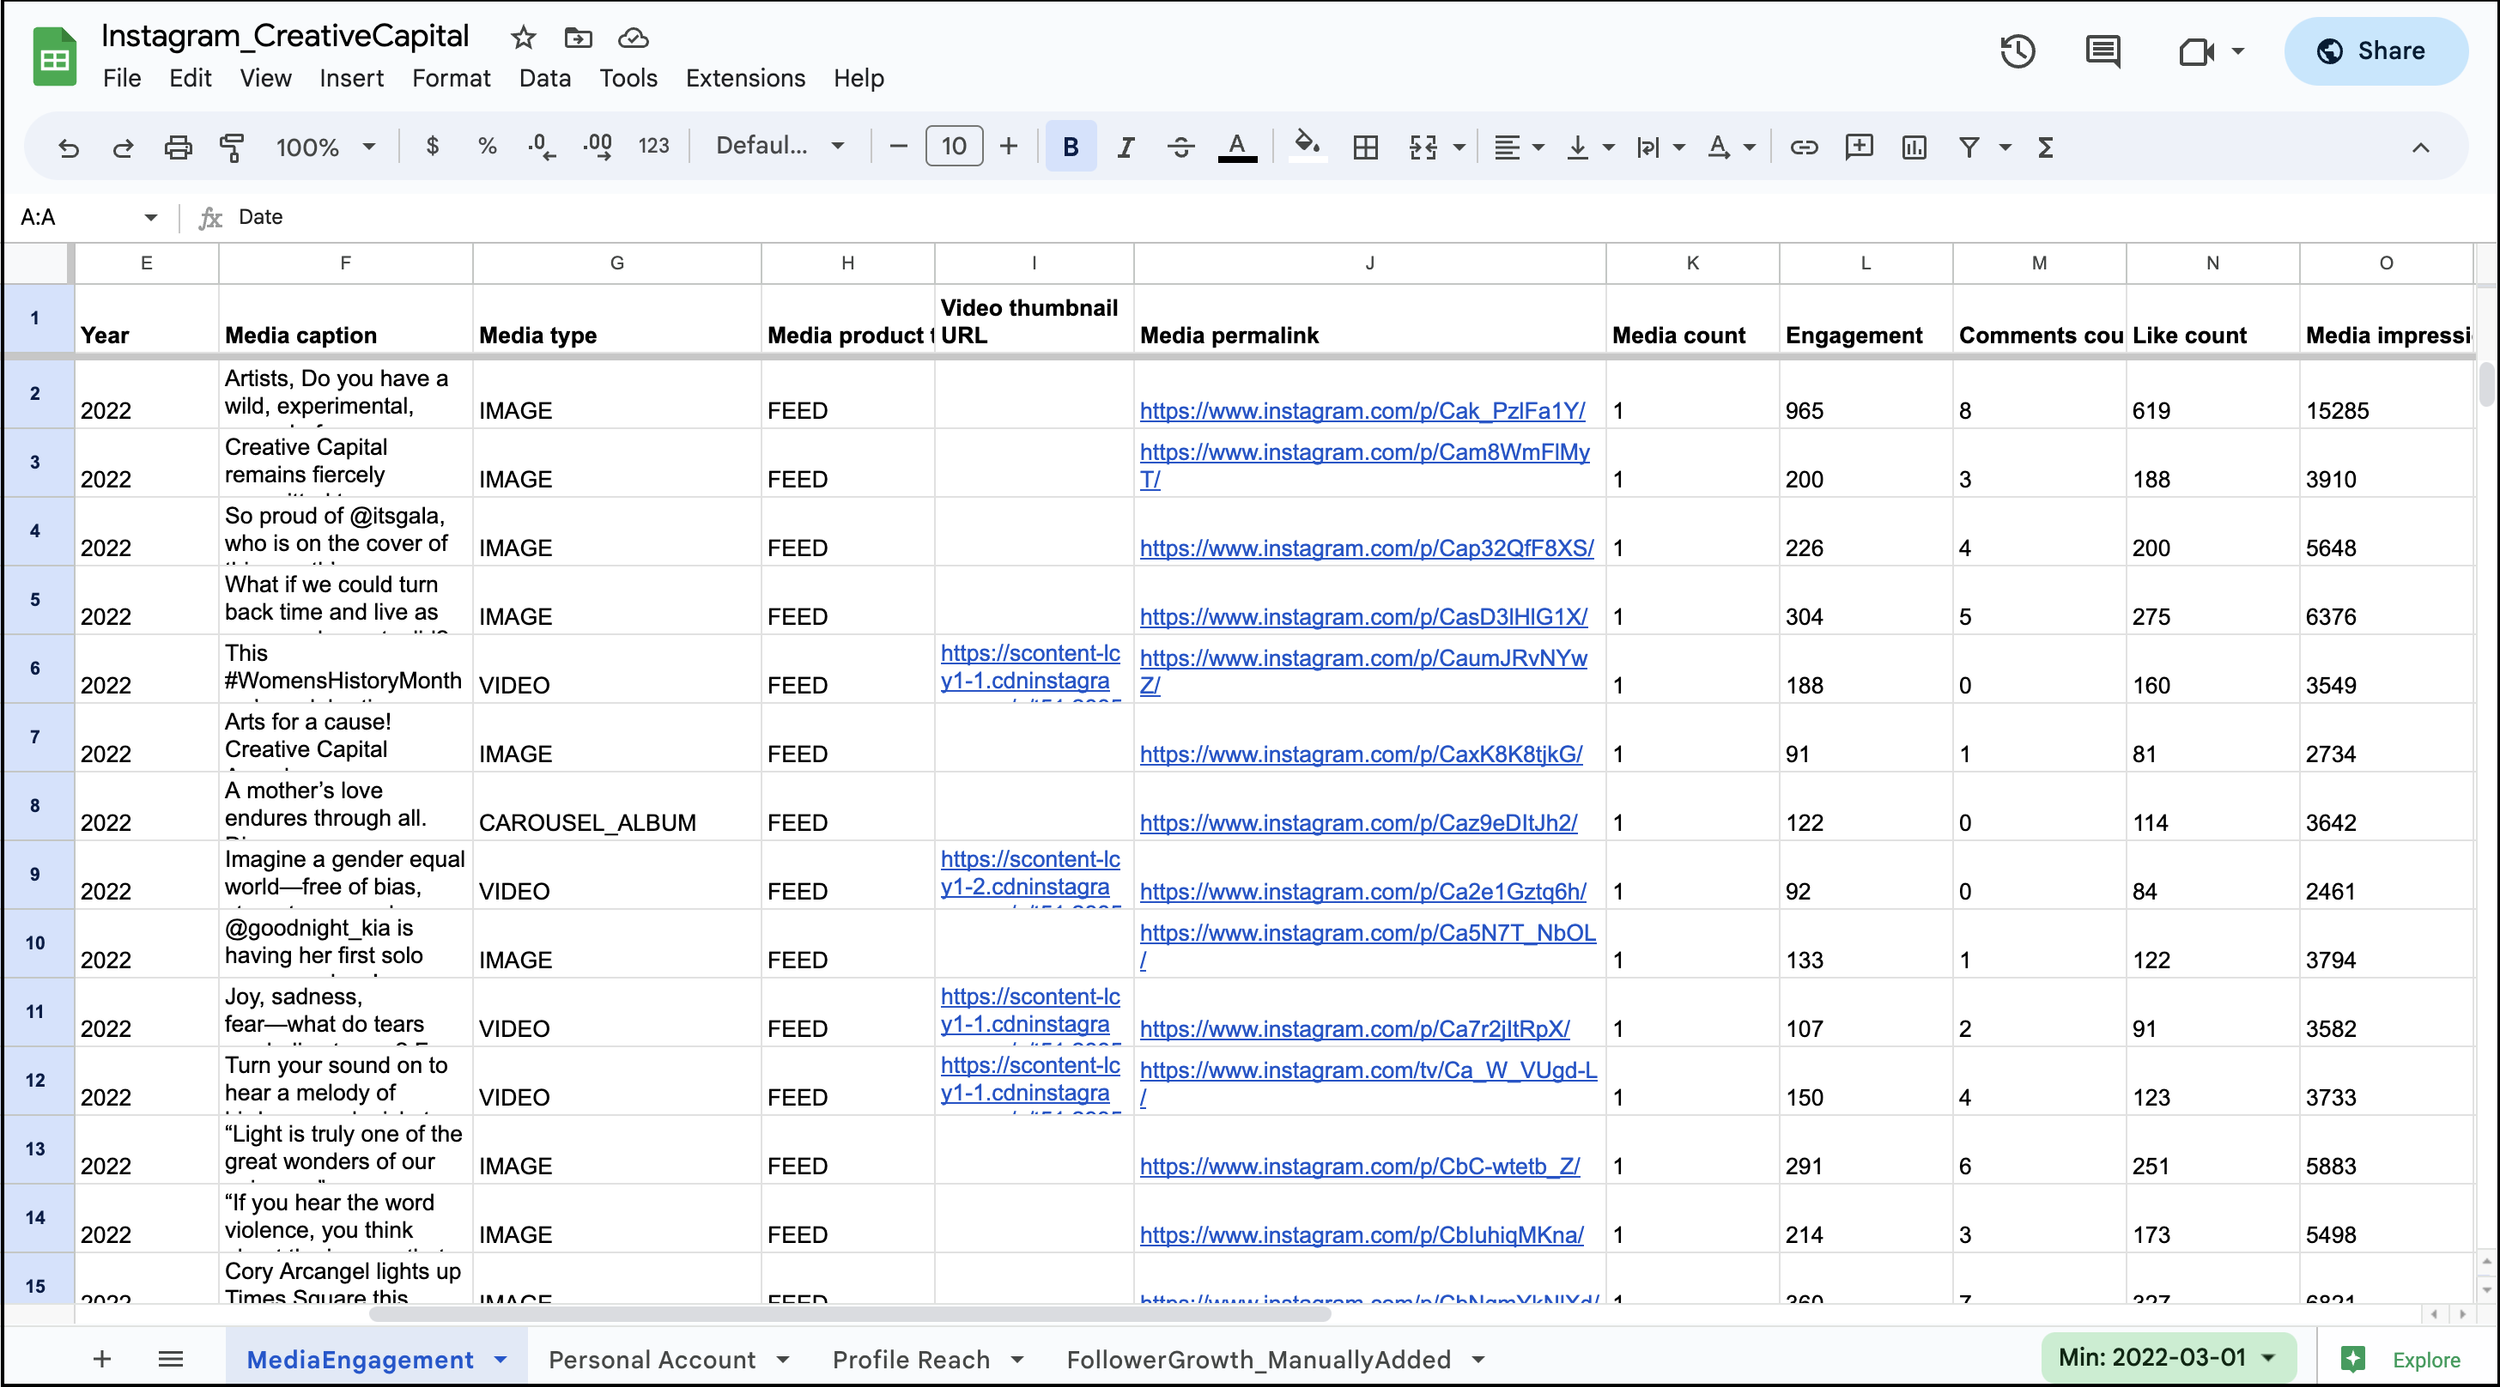
Data collection in Google Sheets
Google Analytics

Google Analytics Explorations
Our Comprehensive Approach to Social Media and Google Analytics
Our process for analyzing Creative Capital's digital presence involved 2 key areas of analysis: Social media & Website analytics
In order to analyze the social media analytics, we used Supermetrics to gather data from Creative Capital's Instagram account, focusing on engagement, overall account details, and posts related to donations. We used Looker Studio to visualize the data and identify trends and patterns.
=

Dashboard created in Looker Studio
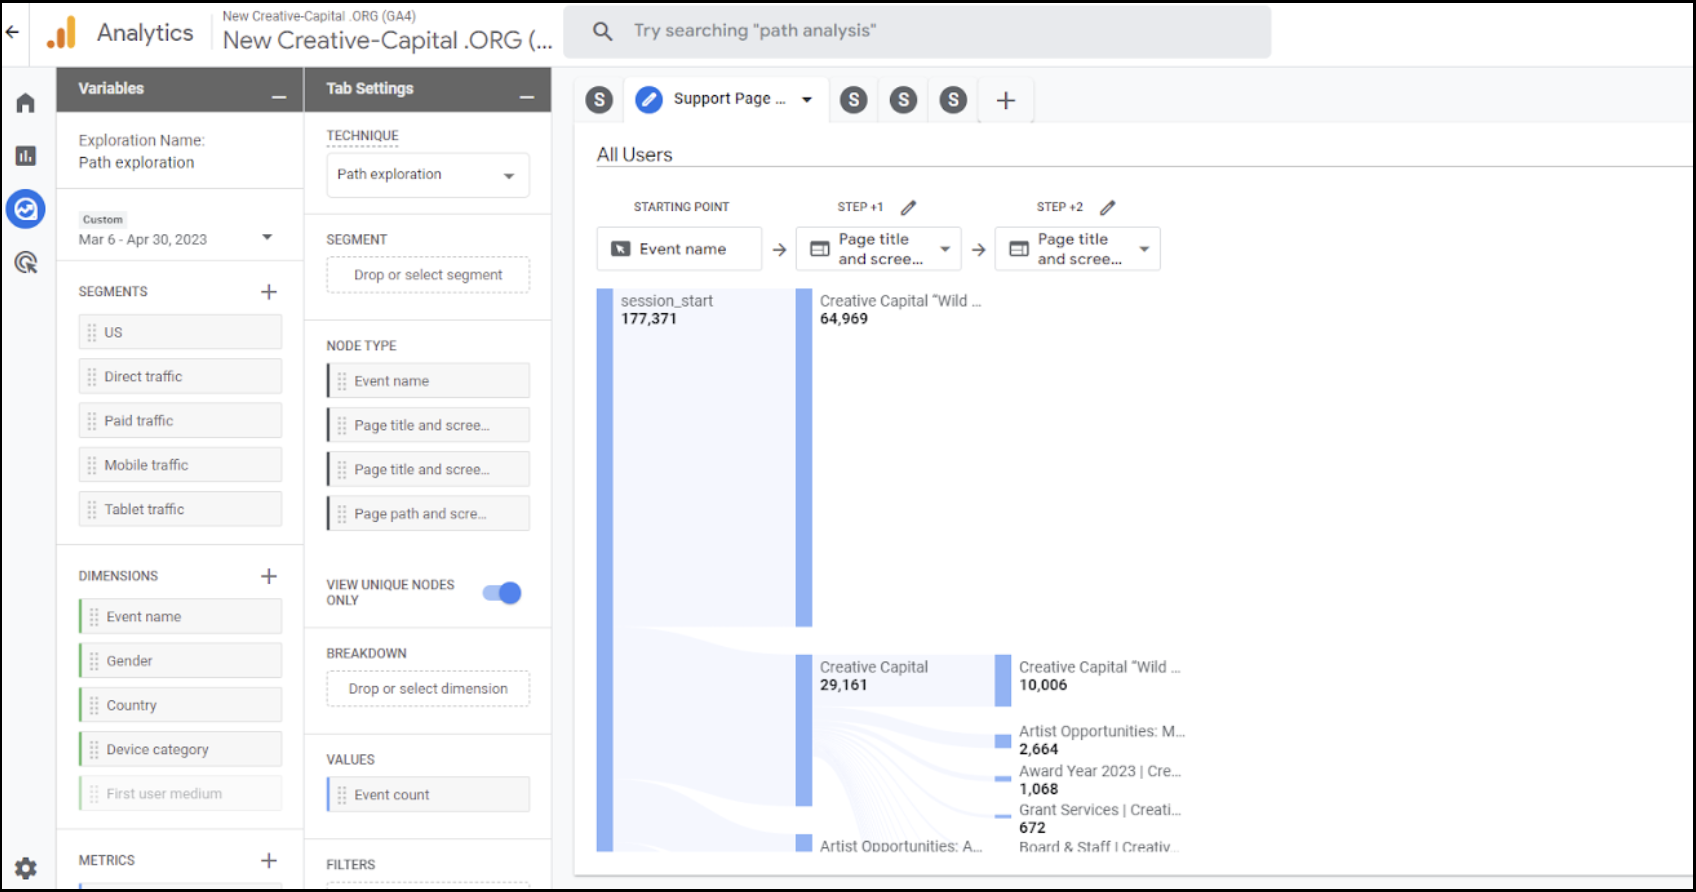
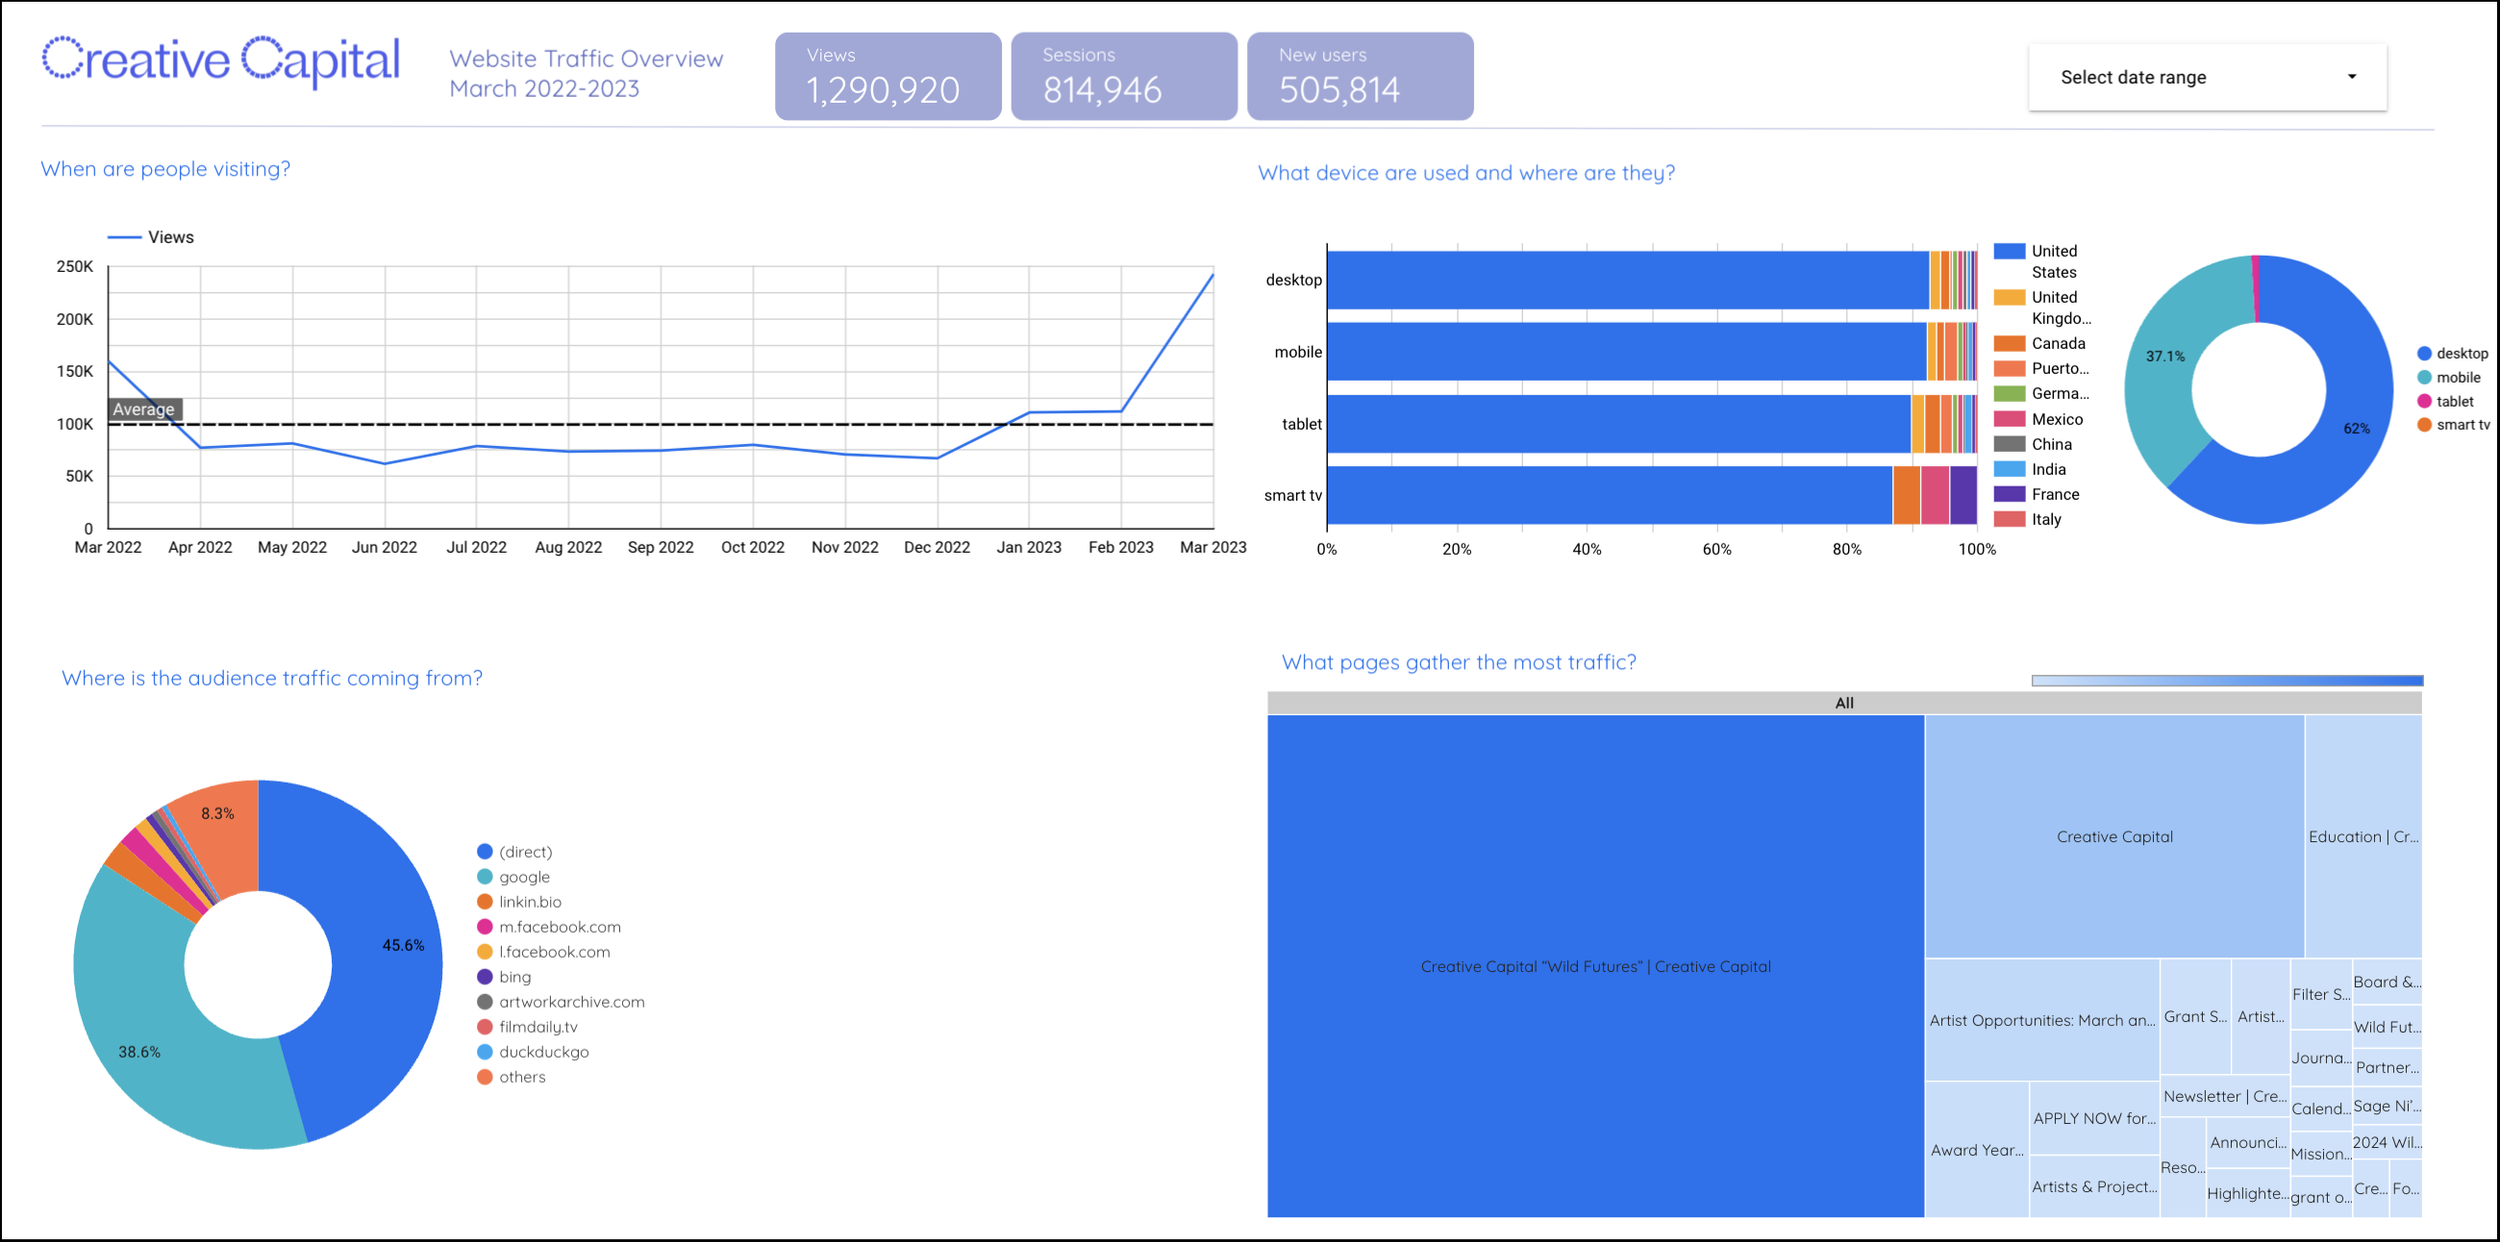
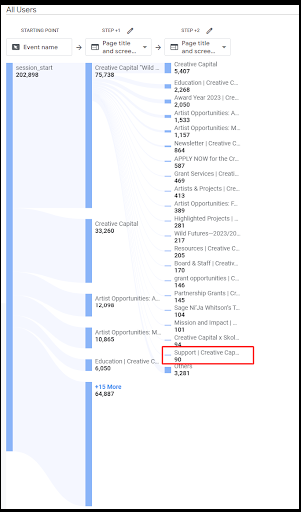
For website analysis, we acquired Google Analytics access, utilizing GA4 Explore for journey maps and user behavior tracking. Looker Studio dashboards depicted site traffic overview and specific Support and Membership page breakdowns. Path Exploration in GA4 visualized the user journey to the Support page.
Dashboard created in Looker Studio
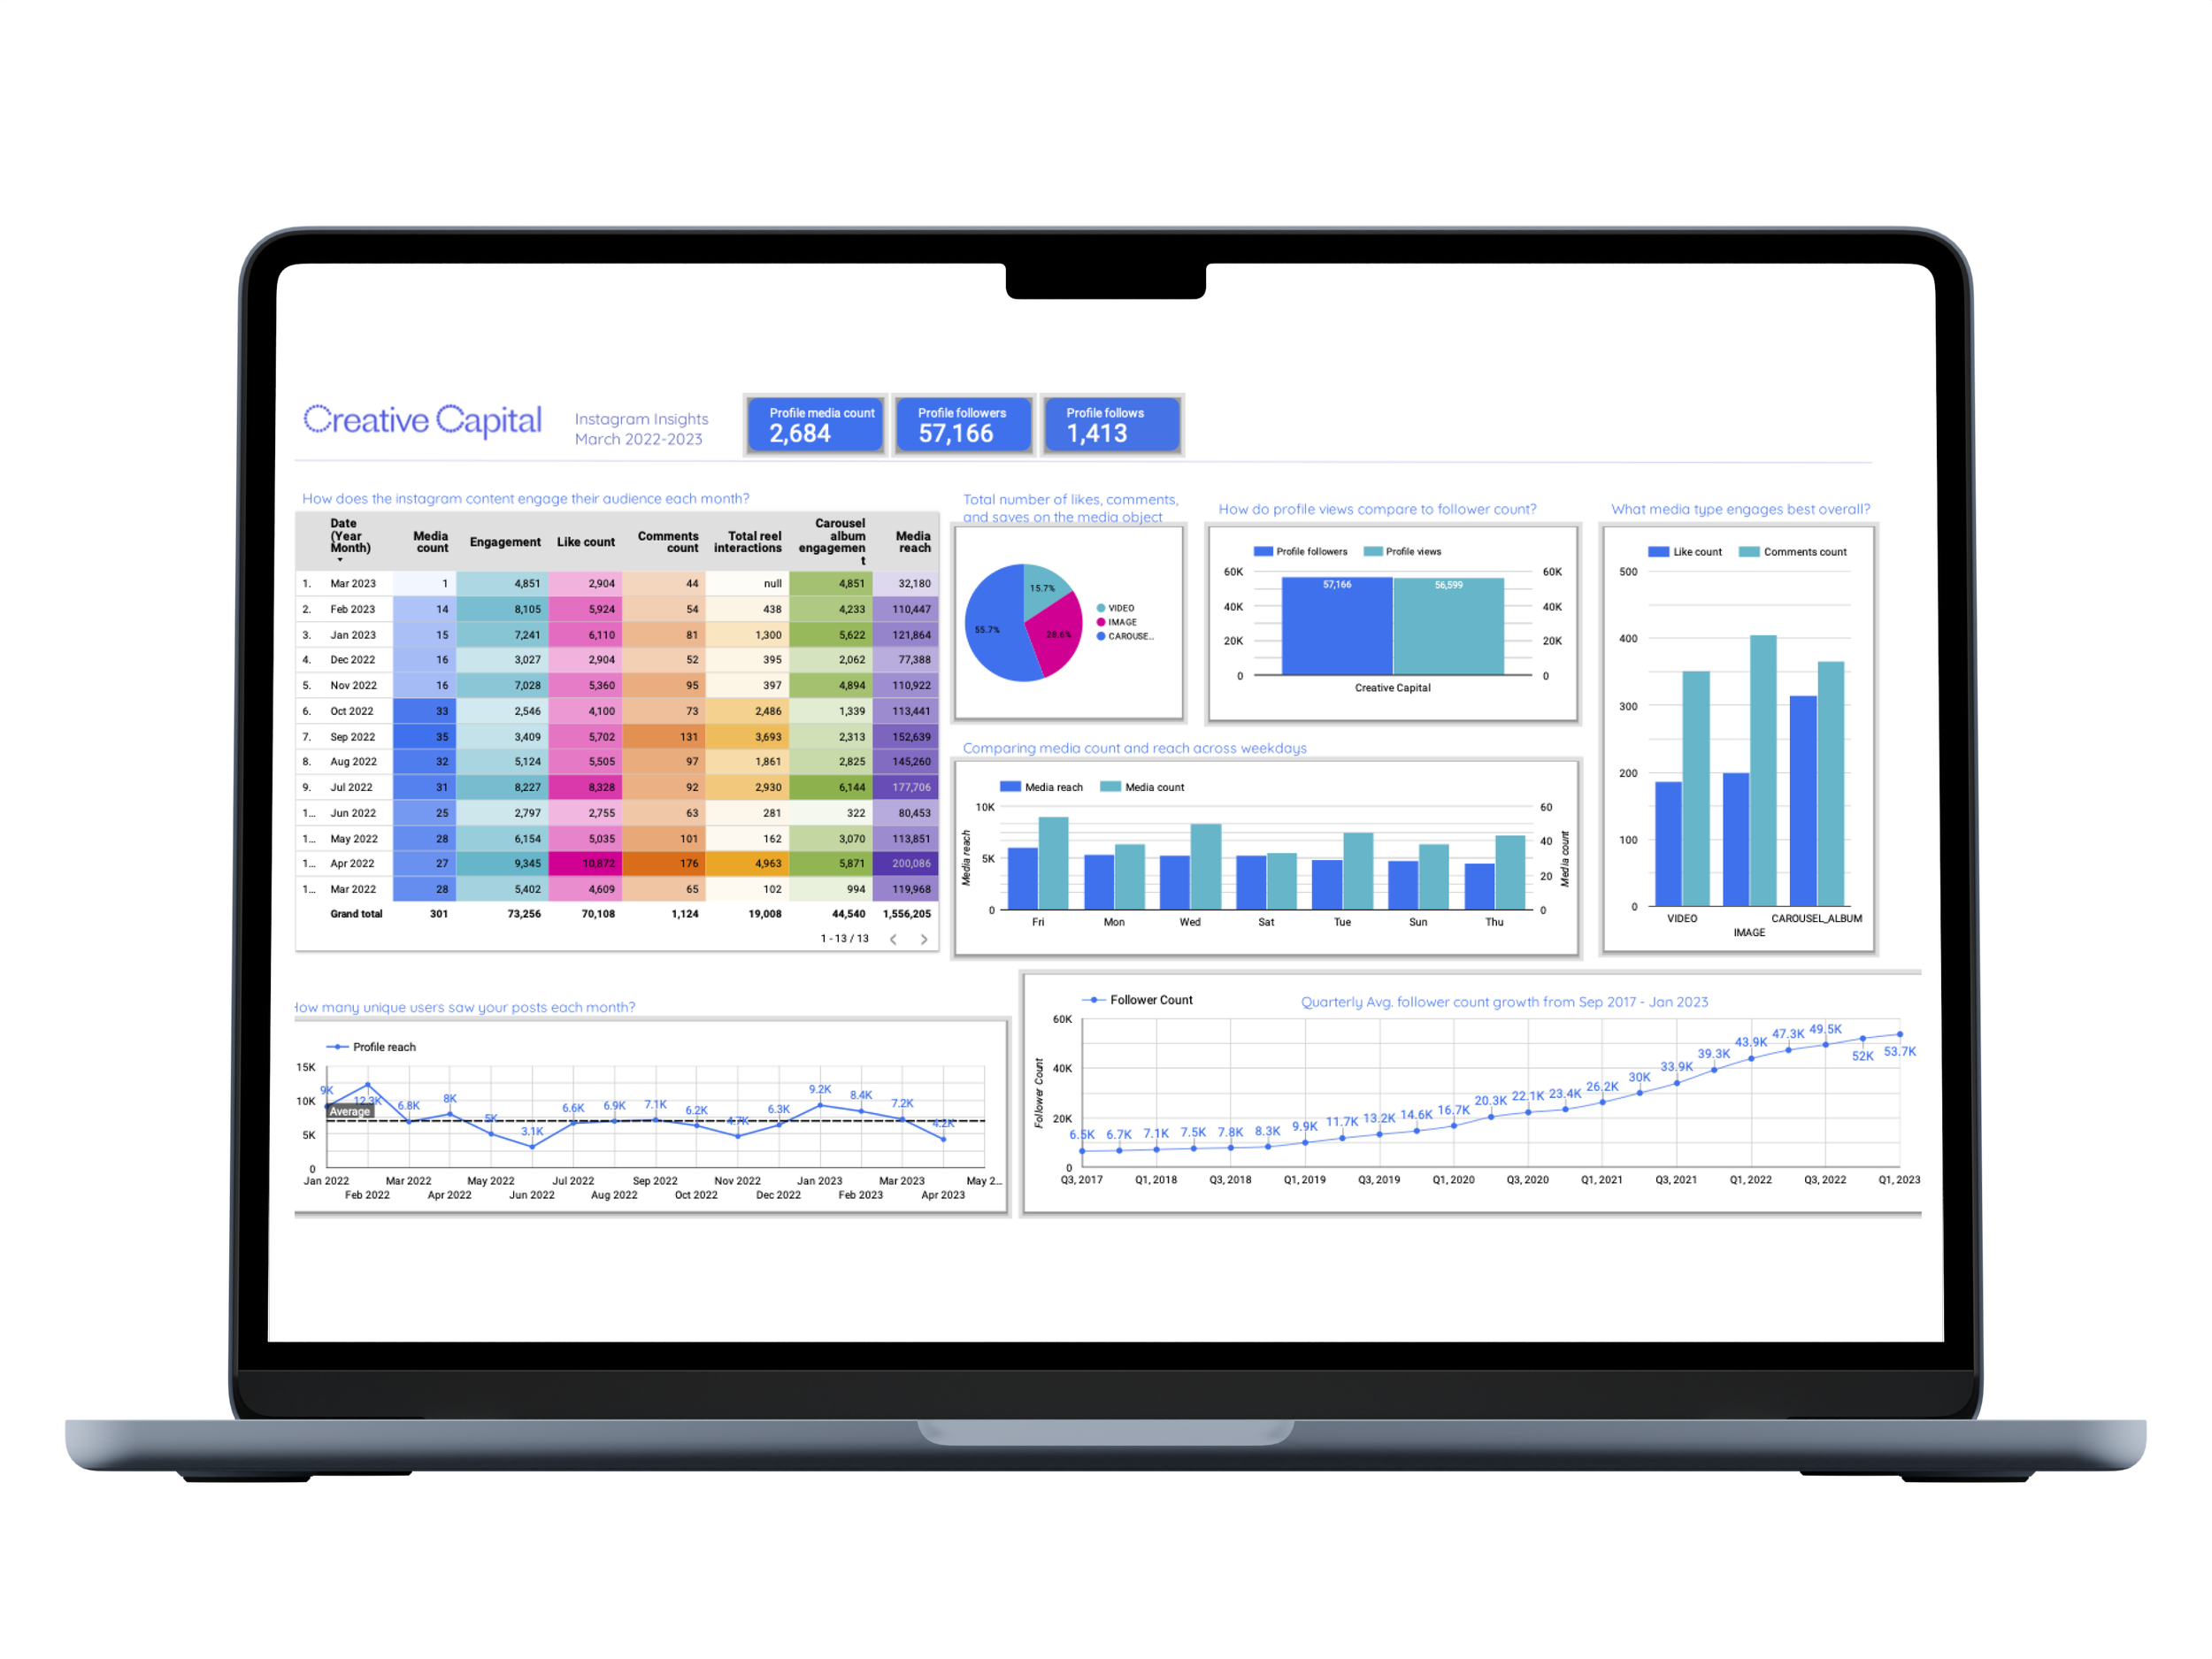
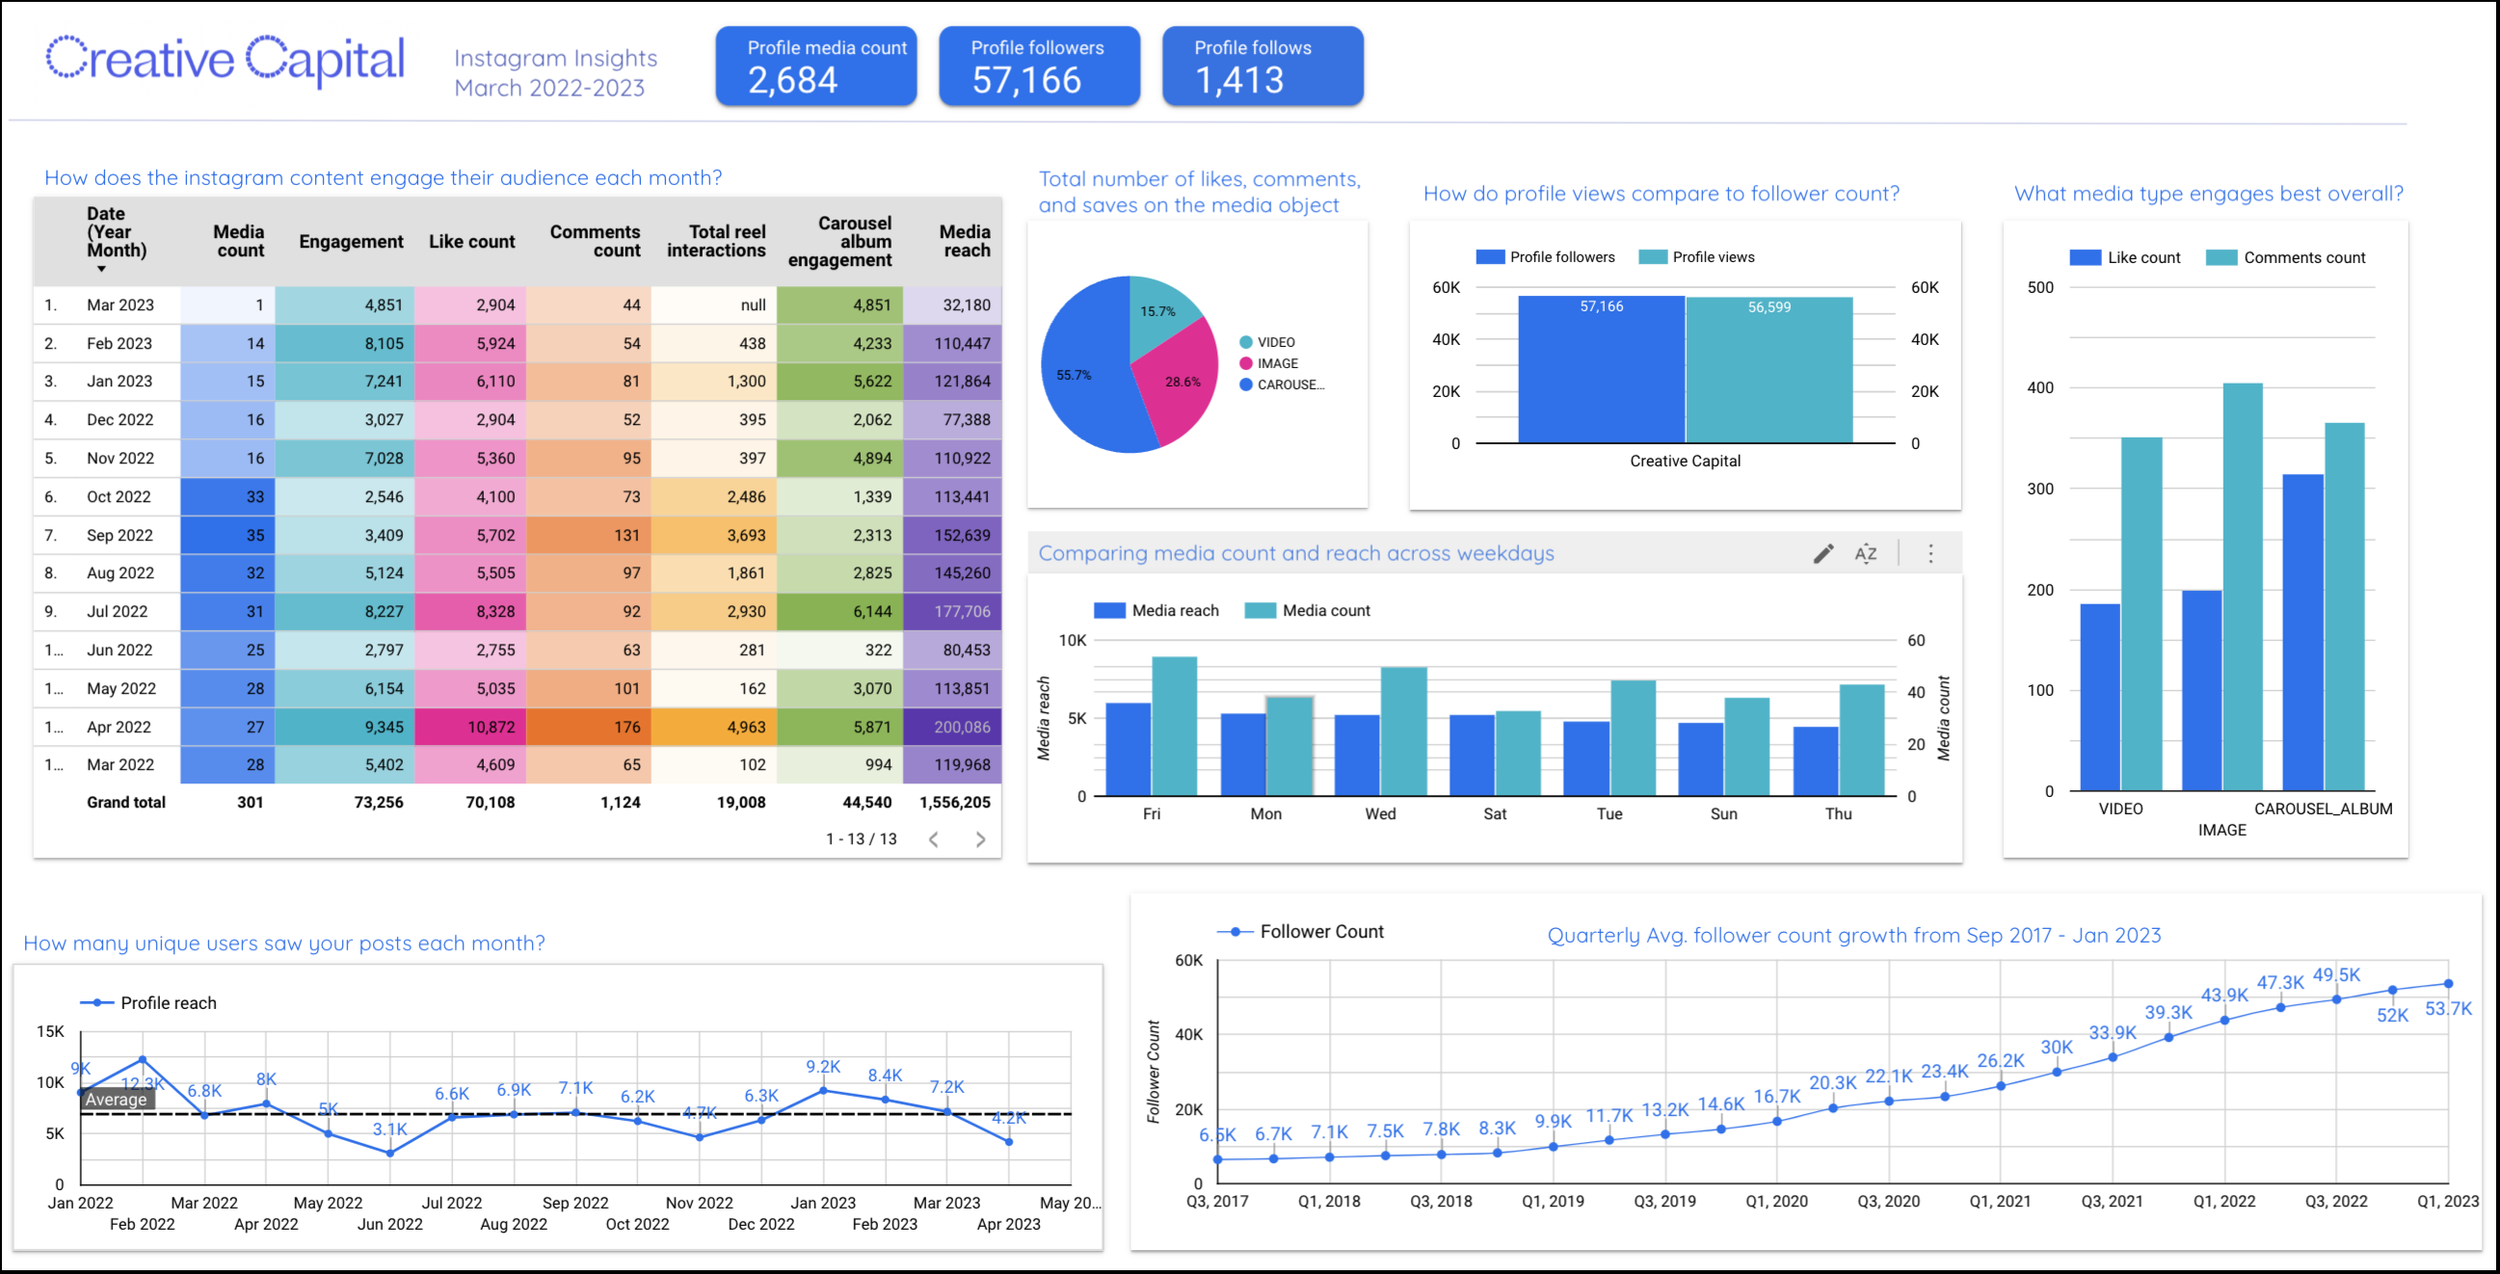
Media Captions Engagement Comments count Like count Follower Growth Profile reach Media Type & more!
Overall, our methodology involved gathering and visualizing data from multiple sources like social media and google analytics to provide a comprehensive understanding of Creative Capital's digital presence and make informed recommendations for their strategy moving forward.
Metrics Explored
Internal Traffic External Traffic Overview Support & Membership
Insights included
Overall insights
Our findings are focused on the Support page and related donor pages. Our subsequent recommendations range from usability improvements to content strategy adjustments.
Key Insights from Analyzing Creative Capital's Digital Presence
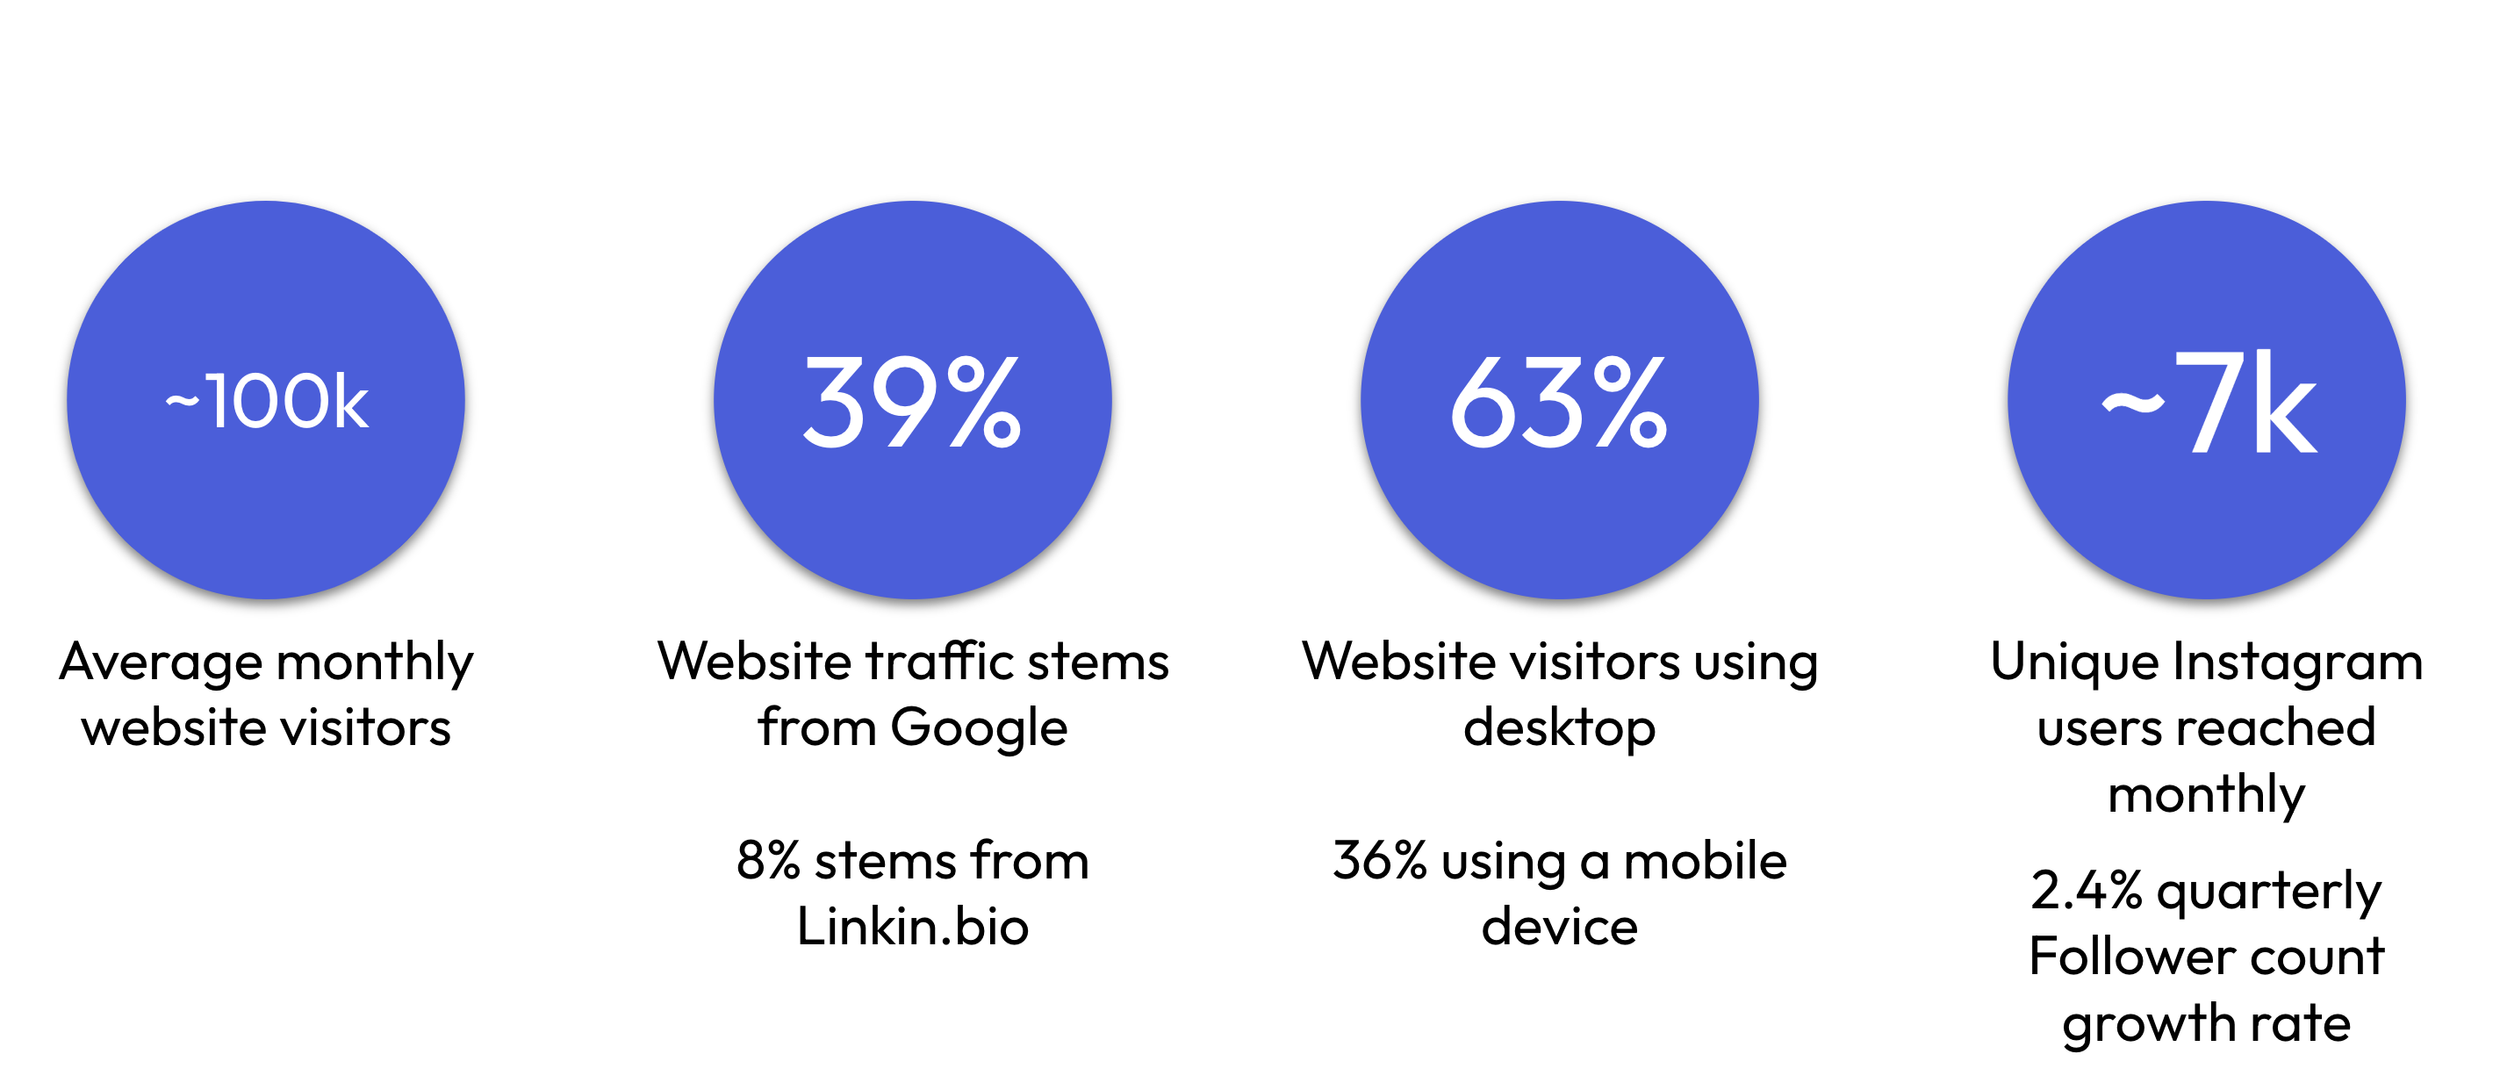
Overview: Creative Capital’s digital footprint from March 2022 - March 2023 at a glance:
Support Page Findings
Finding 1
Path Exploration reveals low traffic to Support page
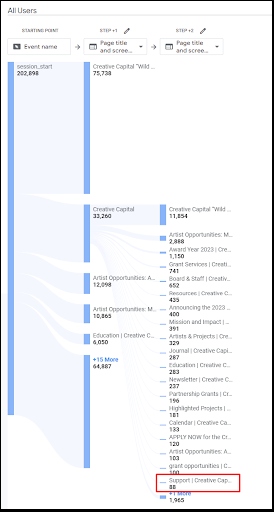
Through path exploration, we uncovered a significant issue with our Support page here at Creative Capital. Surprisingly, this page received very little traffic, with just 1,119 users out of a total 1,290,920 website visitors from March 2022 to March 2023, representing only 0.09% of our audience according to Universal Analytics.
Our analysis with Google Analytics 4 revealed that even our popular pages like Wild Futures and the homepage had extremely low click-through rates to the Support page (0.12% and 0.26% respectively). Similarly, in the case of the Support page being the third page a viewer visited, less than 0.38% of users reach it. We observed that these consistently low views for the Support page indicated a structural issue on the website in terms of fundraising and donation encouragement.
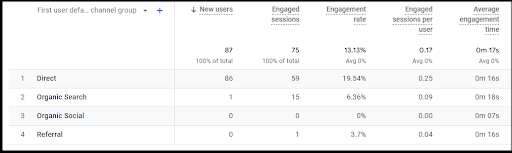
Furthermore, the majority of our external traffic was sourced from direct links, especially among new website users who were actively seeking to support Creative Capital. Interestingly, there were no new users driven to the website from social media, which may have been due to incomplete social media link integration in GA4.
Finding 2
Among the four title pages under “Organization” on Creative Capital’s website, the Support page receives the second fewest page views. Between March 2022 and March 2023, the Support page received 1,017 views, about 7% of the page views received by the Board & Staff page.
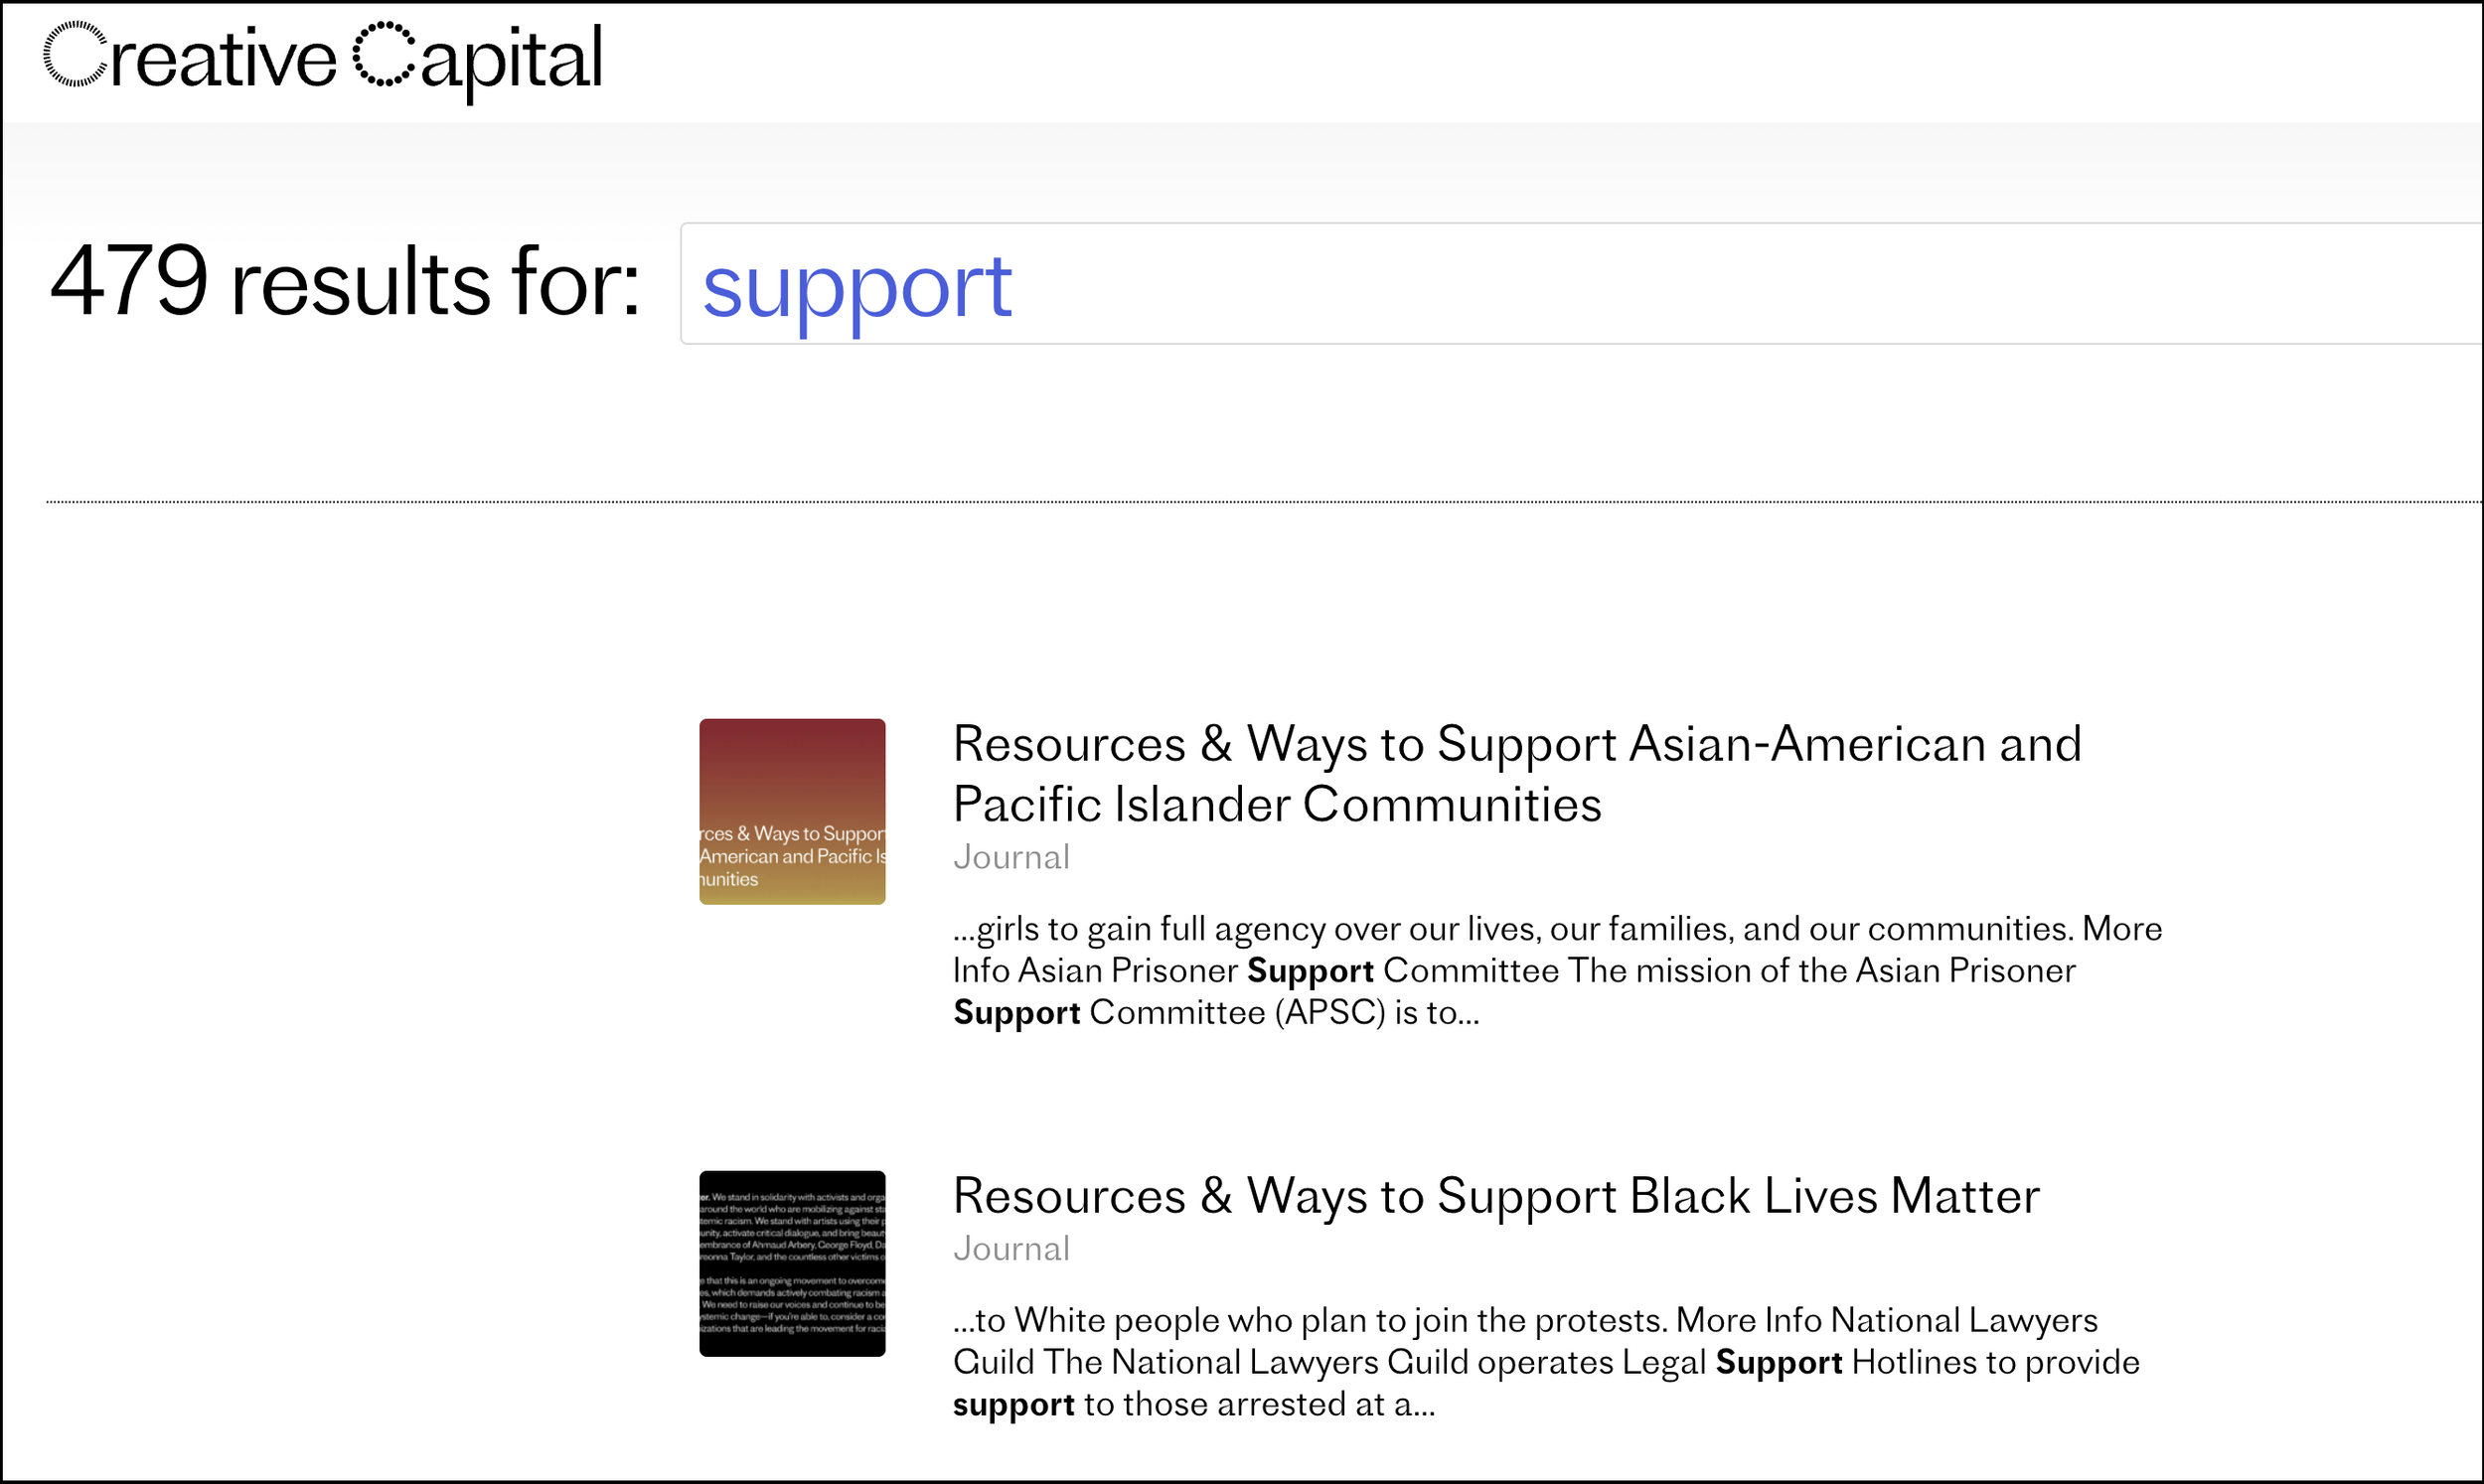
Despite being the only top-level page with additional context on the impact of donations, it receives fewer views than journal posts like "Resources & Ways to Support Black Lives Matter." This impacts the findability of how to donate to Creative Capital, as the word "support" is used in two different contexts on the website. When users search 'support' in Creative Capital's internal search bar, the Support page doesn't appear at all in the search results. In contrast, a search for 'donate' presents the Donate page as the top result."
User visits to the Support Pages are limited
User visits to the Support Pages are limited
Common use of “support” & “membership” across site hides find-ability of Support and Membership pages
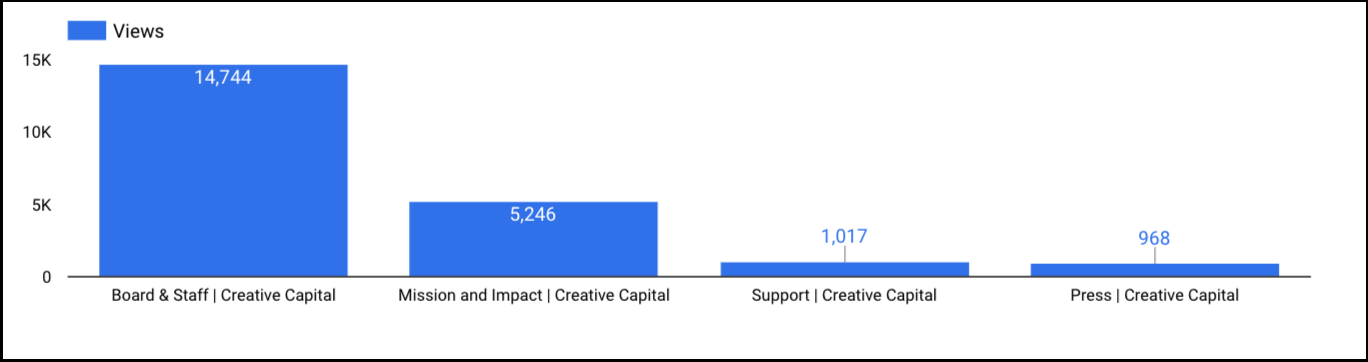
Views for “Organization” Title Pages Mar ‘22 - ‘23
User visits to the Support Pages are limited
Recommendations for Support Pages
Recommendation 1
Use “donate” to refer to financially supporting Creative Capital
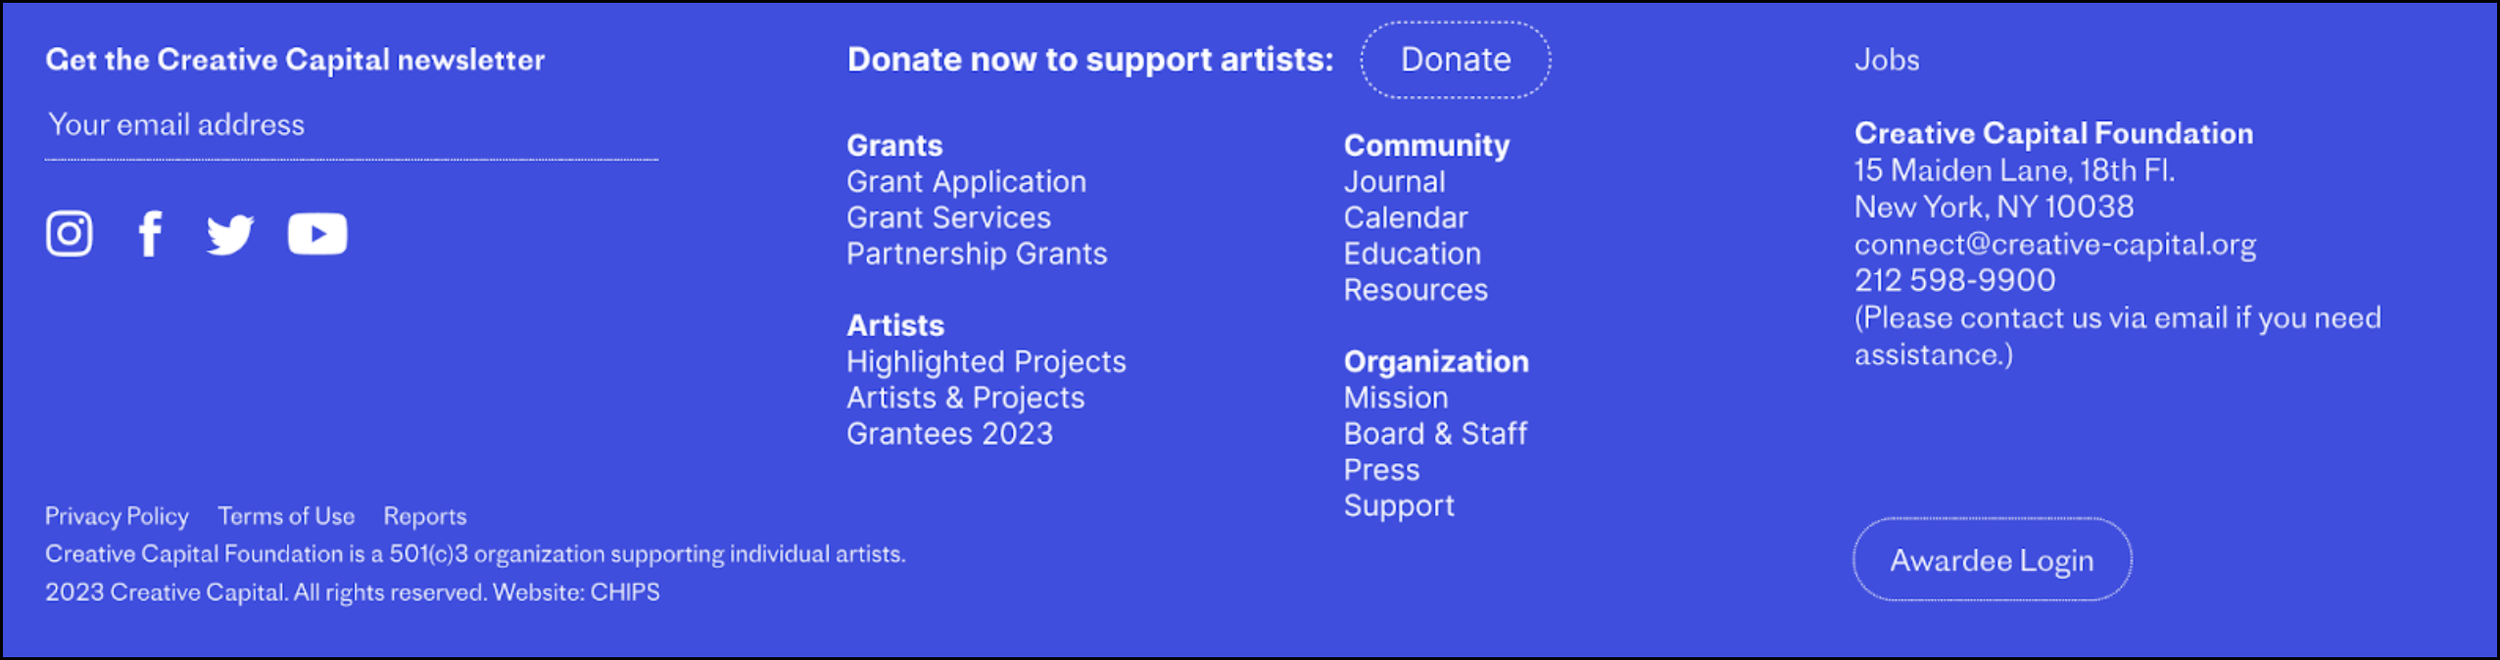
Based on the analysis of Creative Capital's website, we recommend implementing the use of "donate" as the appropriate vocabulary to distinguish posts and pages for financial support from those for supporting artists or social causes.
We suggest placing donate buttons across the website and adding a donate button to the website footer, which would provide users with easy access to the Donate page from anywhere on the site without being intrusive to the content of the post. Additionally, copying the main website navigation into the footer may also be beneficial since page navigation is currently placed in a hidden hamburger menu. These changes would improve the user experience and increase the find-ability of the Support page, ultimately driving more traffic and donations to Creative Capital.
Recommendation 3
Implement Google Analytics optimizations for future analysis
To enhance our analytics and gain a deeper understanding of user engagement, we recommend adding event tracking to key CTAs like newsletter subscriptions and completed donations for better conversion rate data. Additionally, campaign tracking for social media posts will help trace inbound website traffic sources. Implementing GA ecommerce tracking on transaction pages, such as Donate, will provide a comprehensive view of user behavior. To simplify analytics due to Classy's separate GA account, we propose proxying Donate page traffic through creative-capital.org/donate.
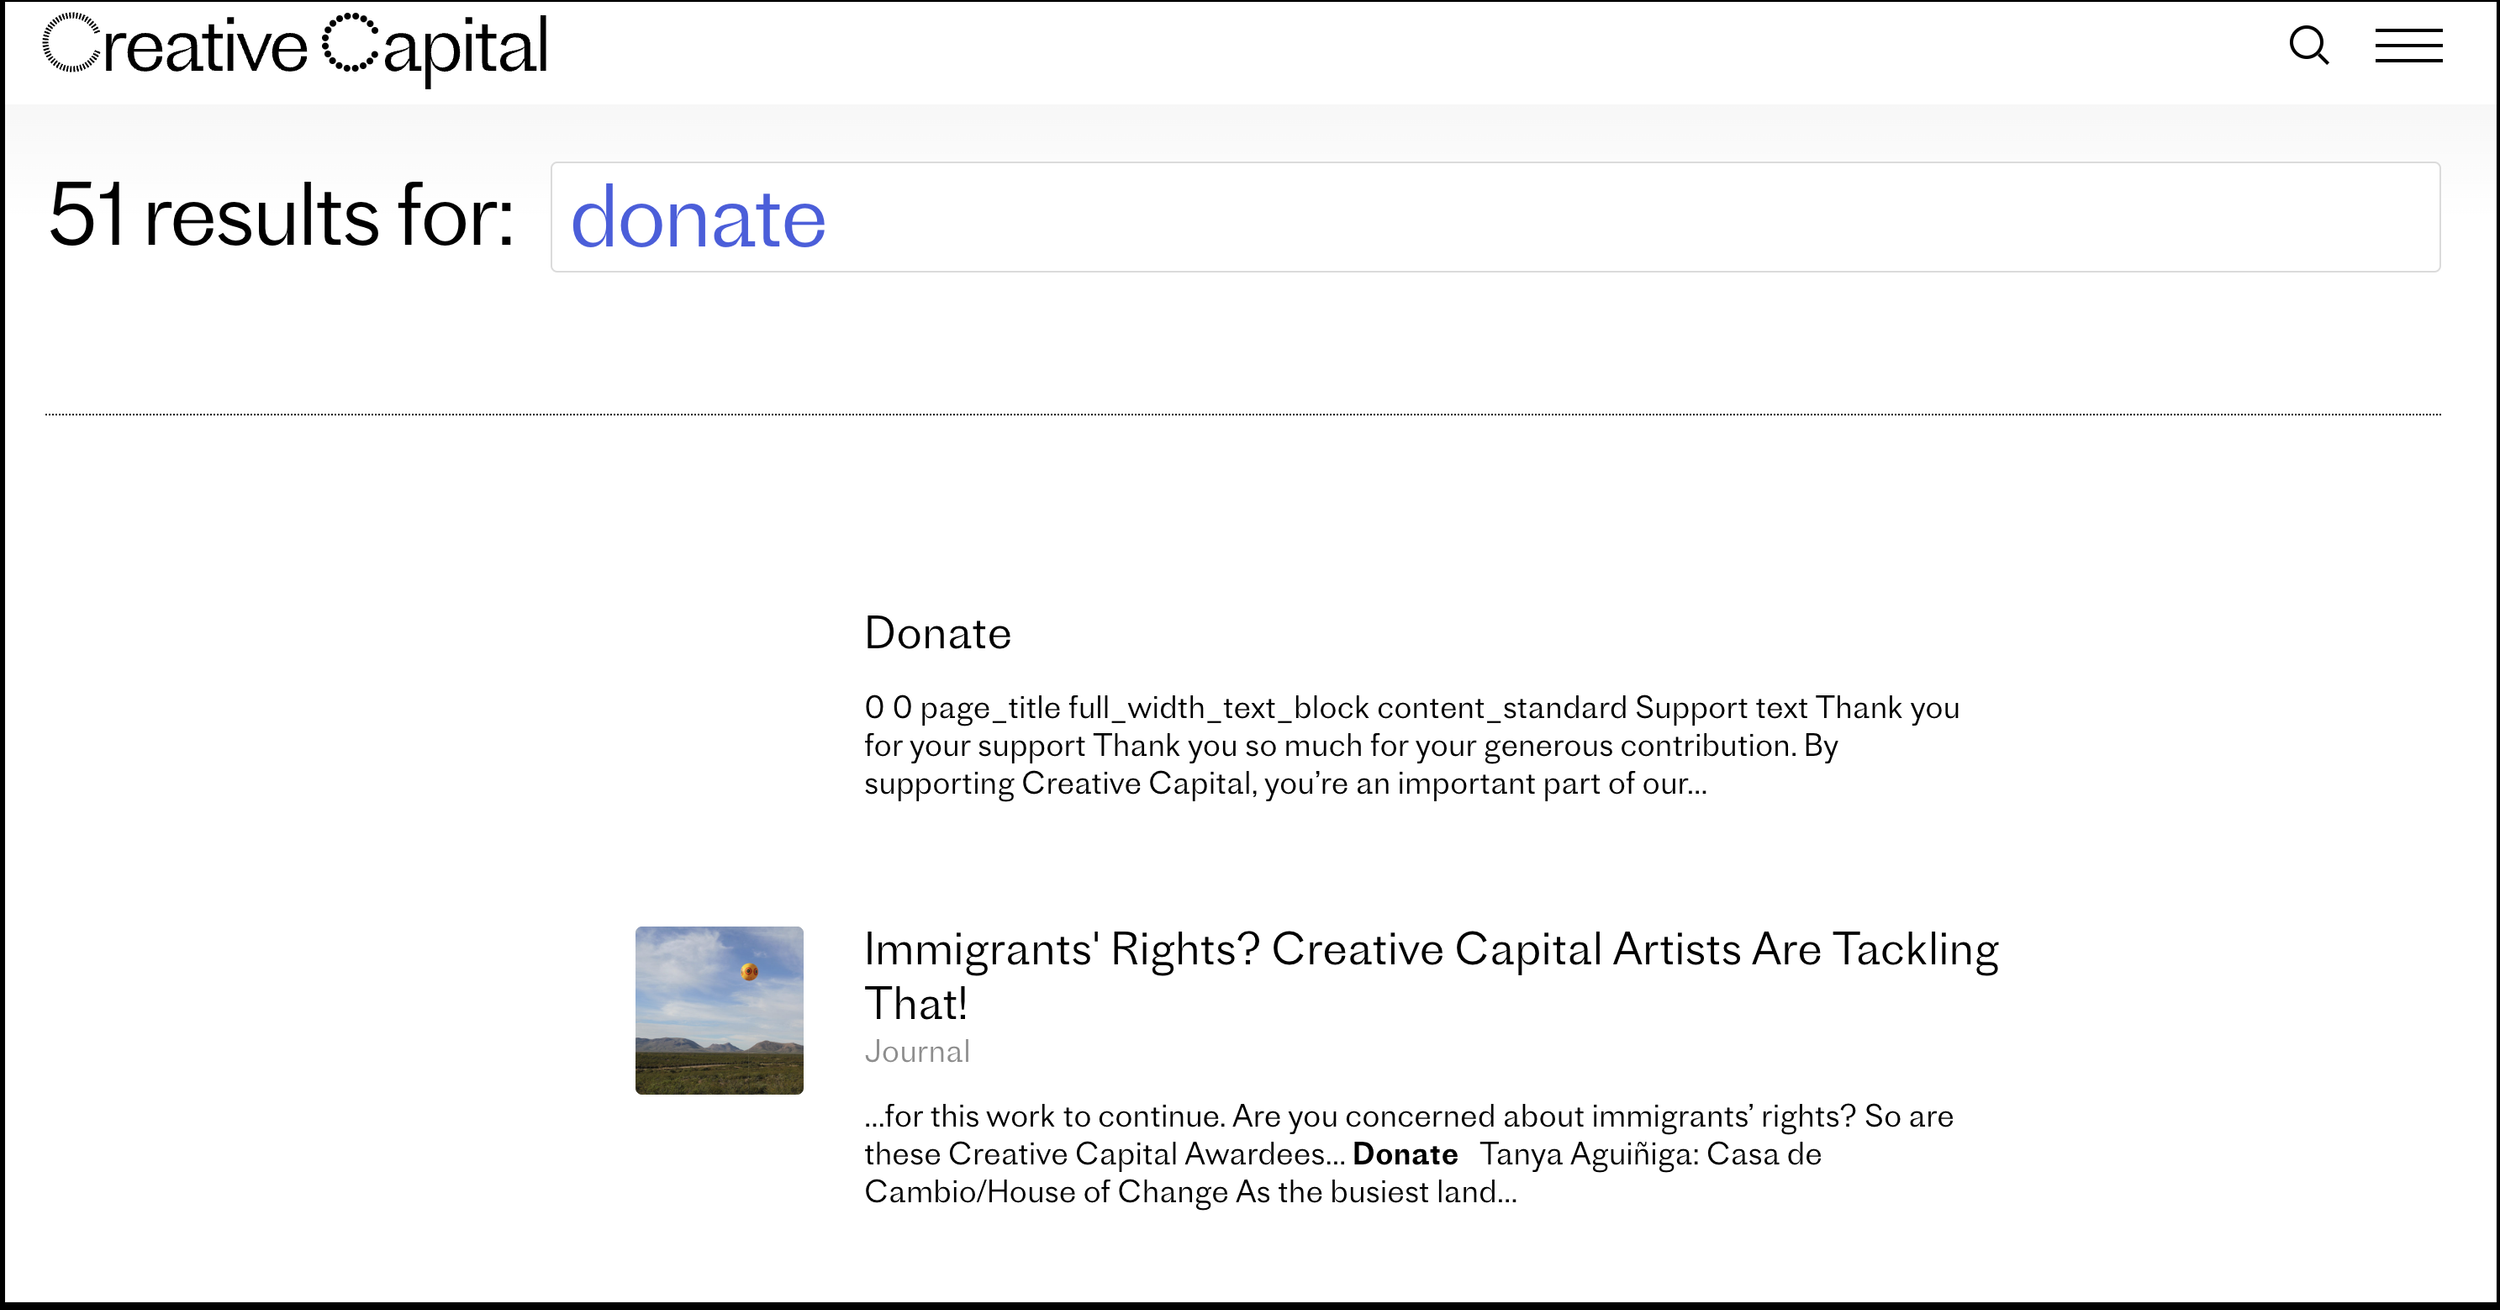
Internal Search results for “donate”
Recommendation 2
Add donate button & navigation menu into footer
Mockup Recommendation
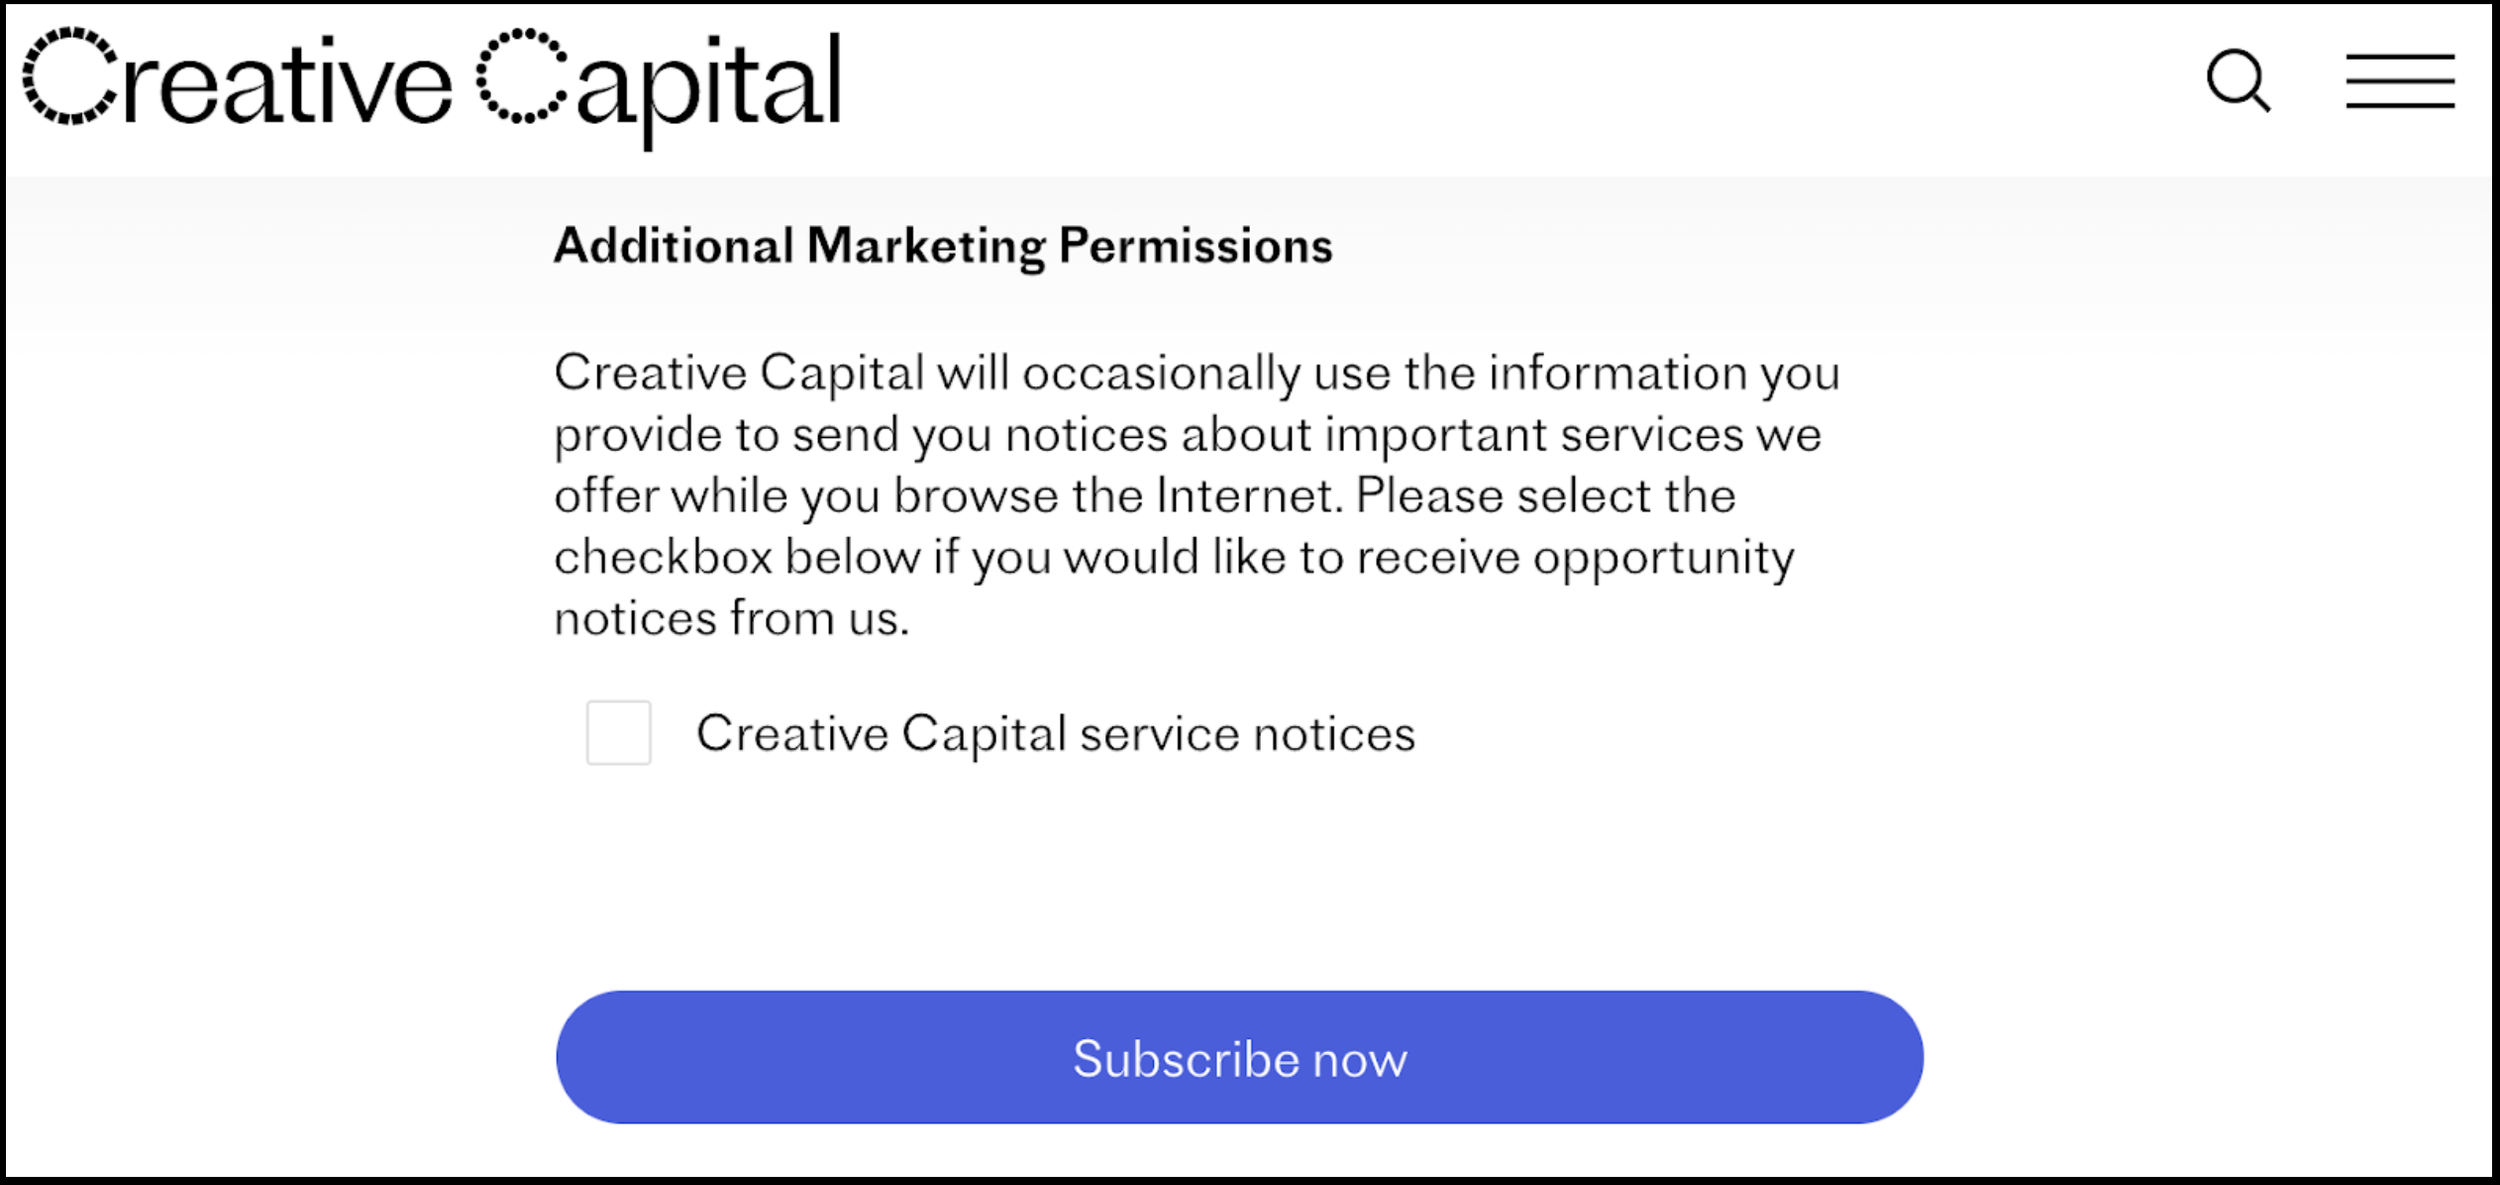
Opportunities to track the clicks on Newsletter subscription
Donate Related Findings
The Creative Capital Donate page lacks key elements that could improve the donor experience and encourage increased support for the organization. The social media share button on the donation page is hidden behind an arrow icon, potentially leading to missed opportunities for increased visibility of the organization.
Additionally, providing specific impact metrics and success stories could help potential donors understand the impact of their contributions and increase the likelihood of giving.
In addition to the separate Supporters and Membership pages within the Support page, highlighting these two pages’ information directly on the Donate page could provide potential donors with a better understanding of the organization and potentially increase motivation to donate.
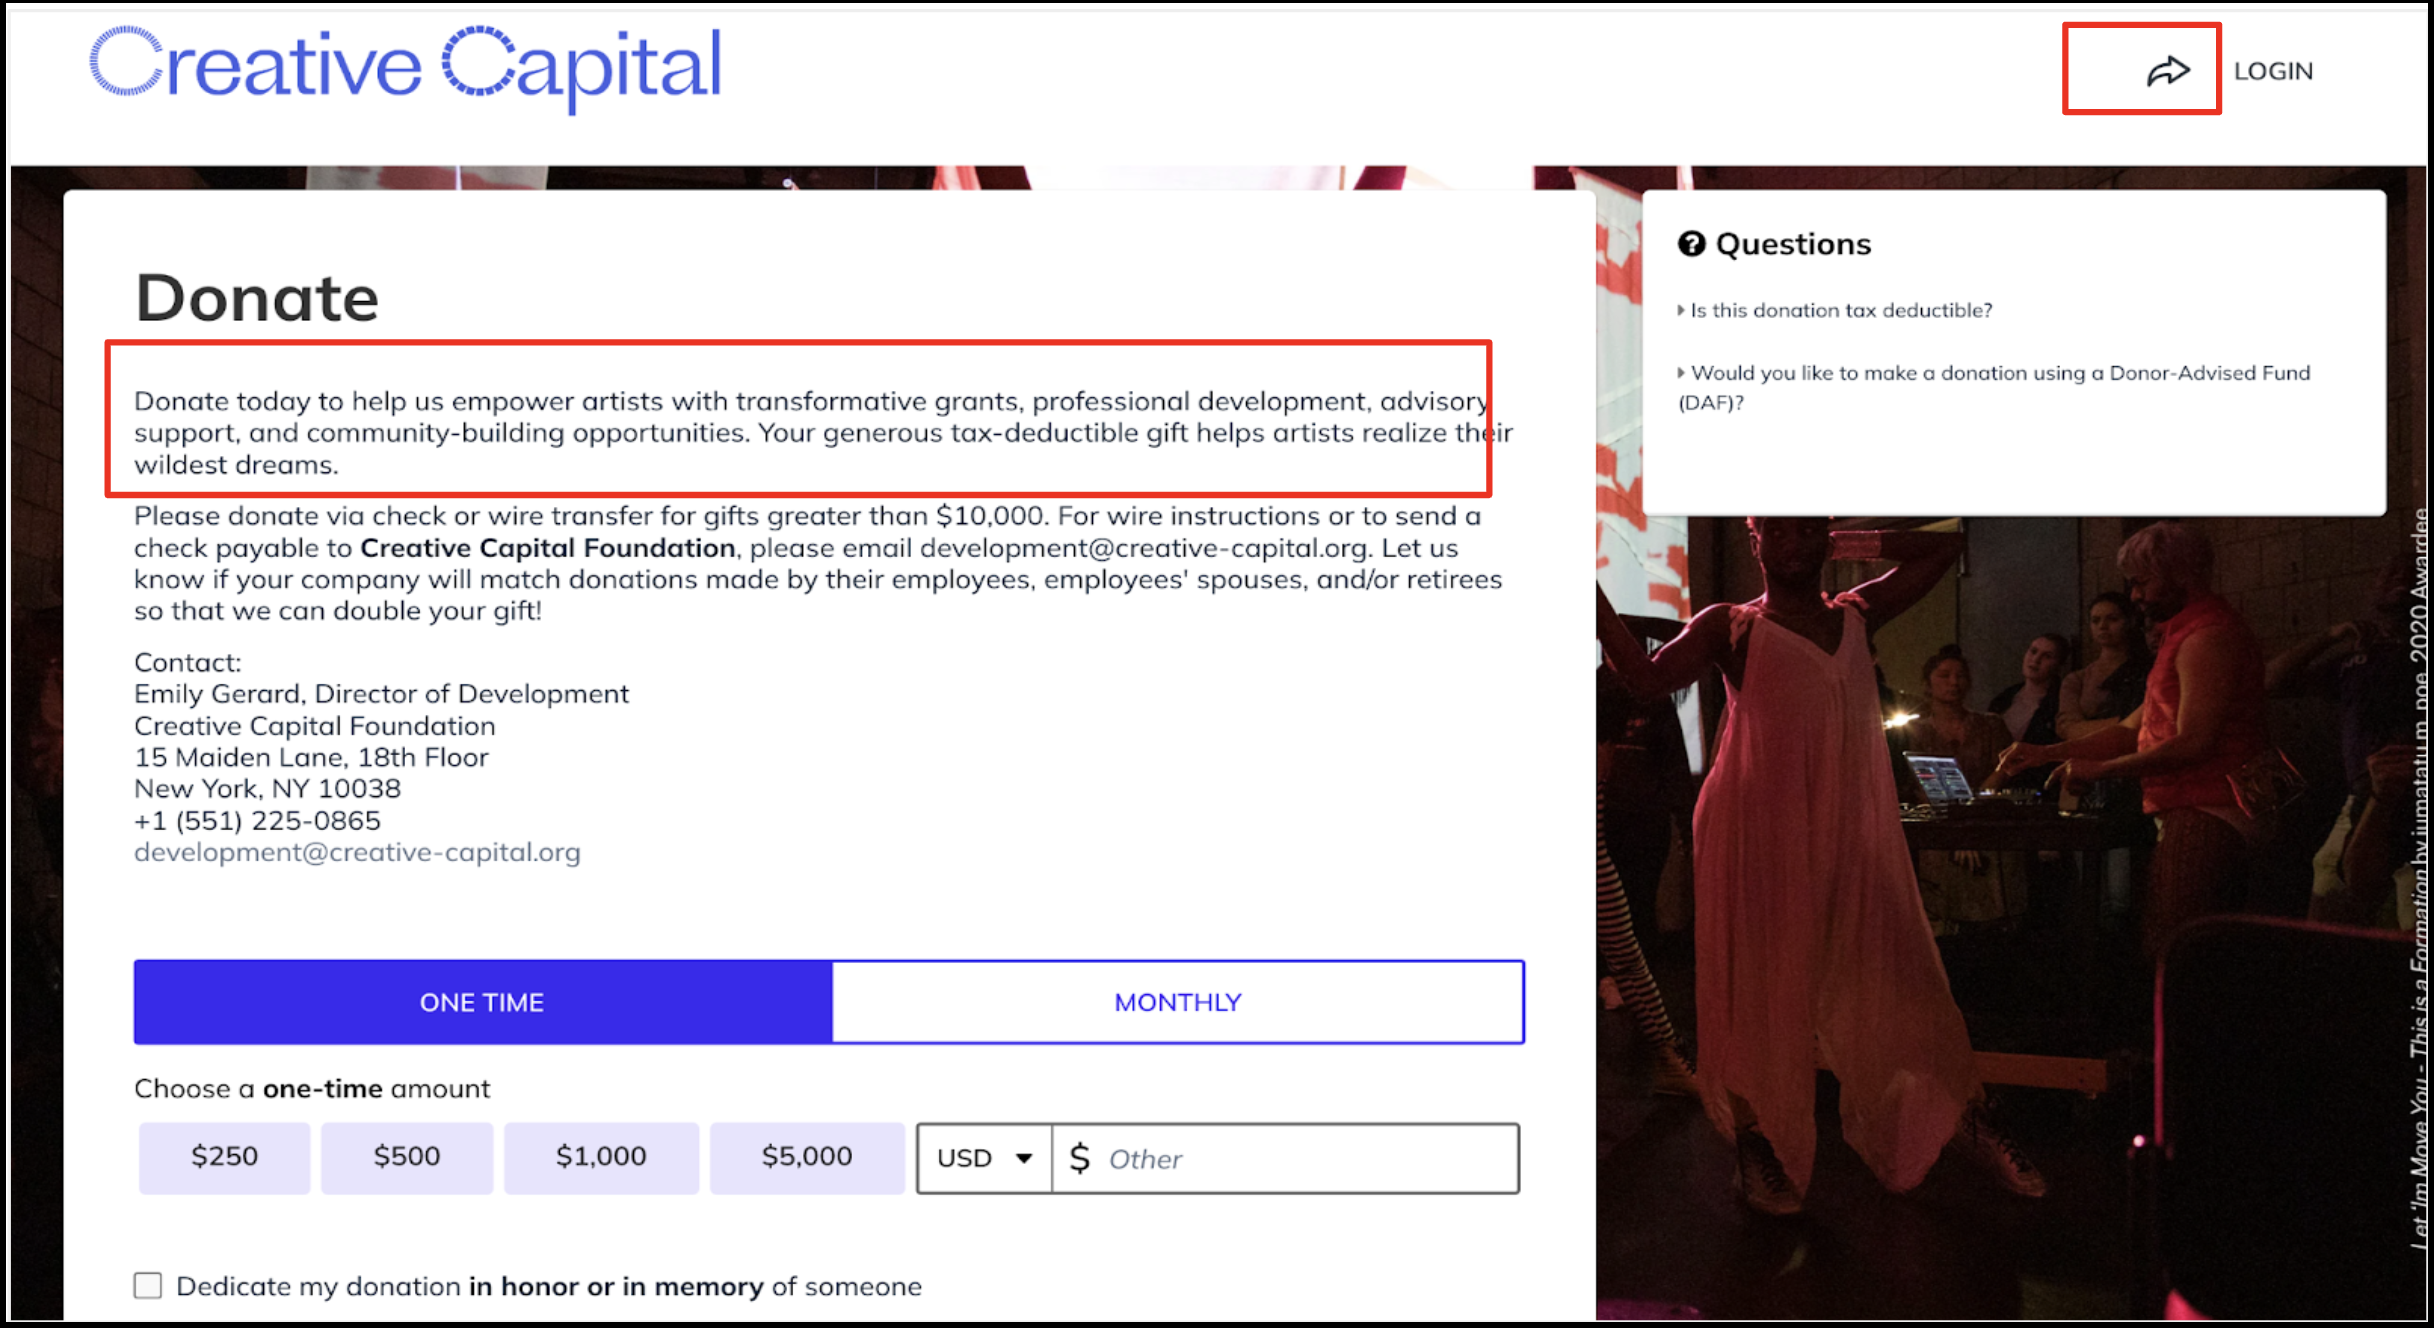
Creative Capital’s Donate Page
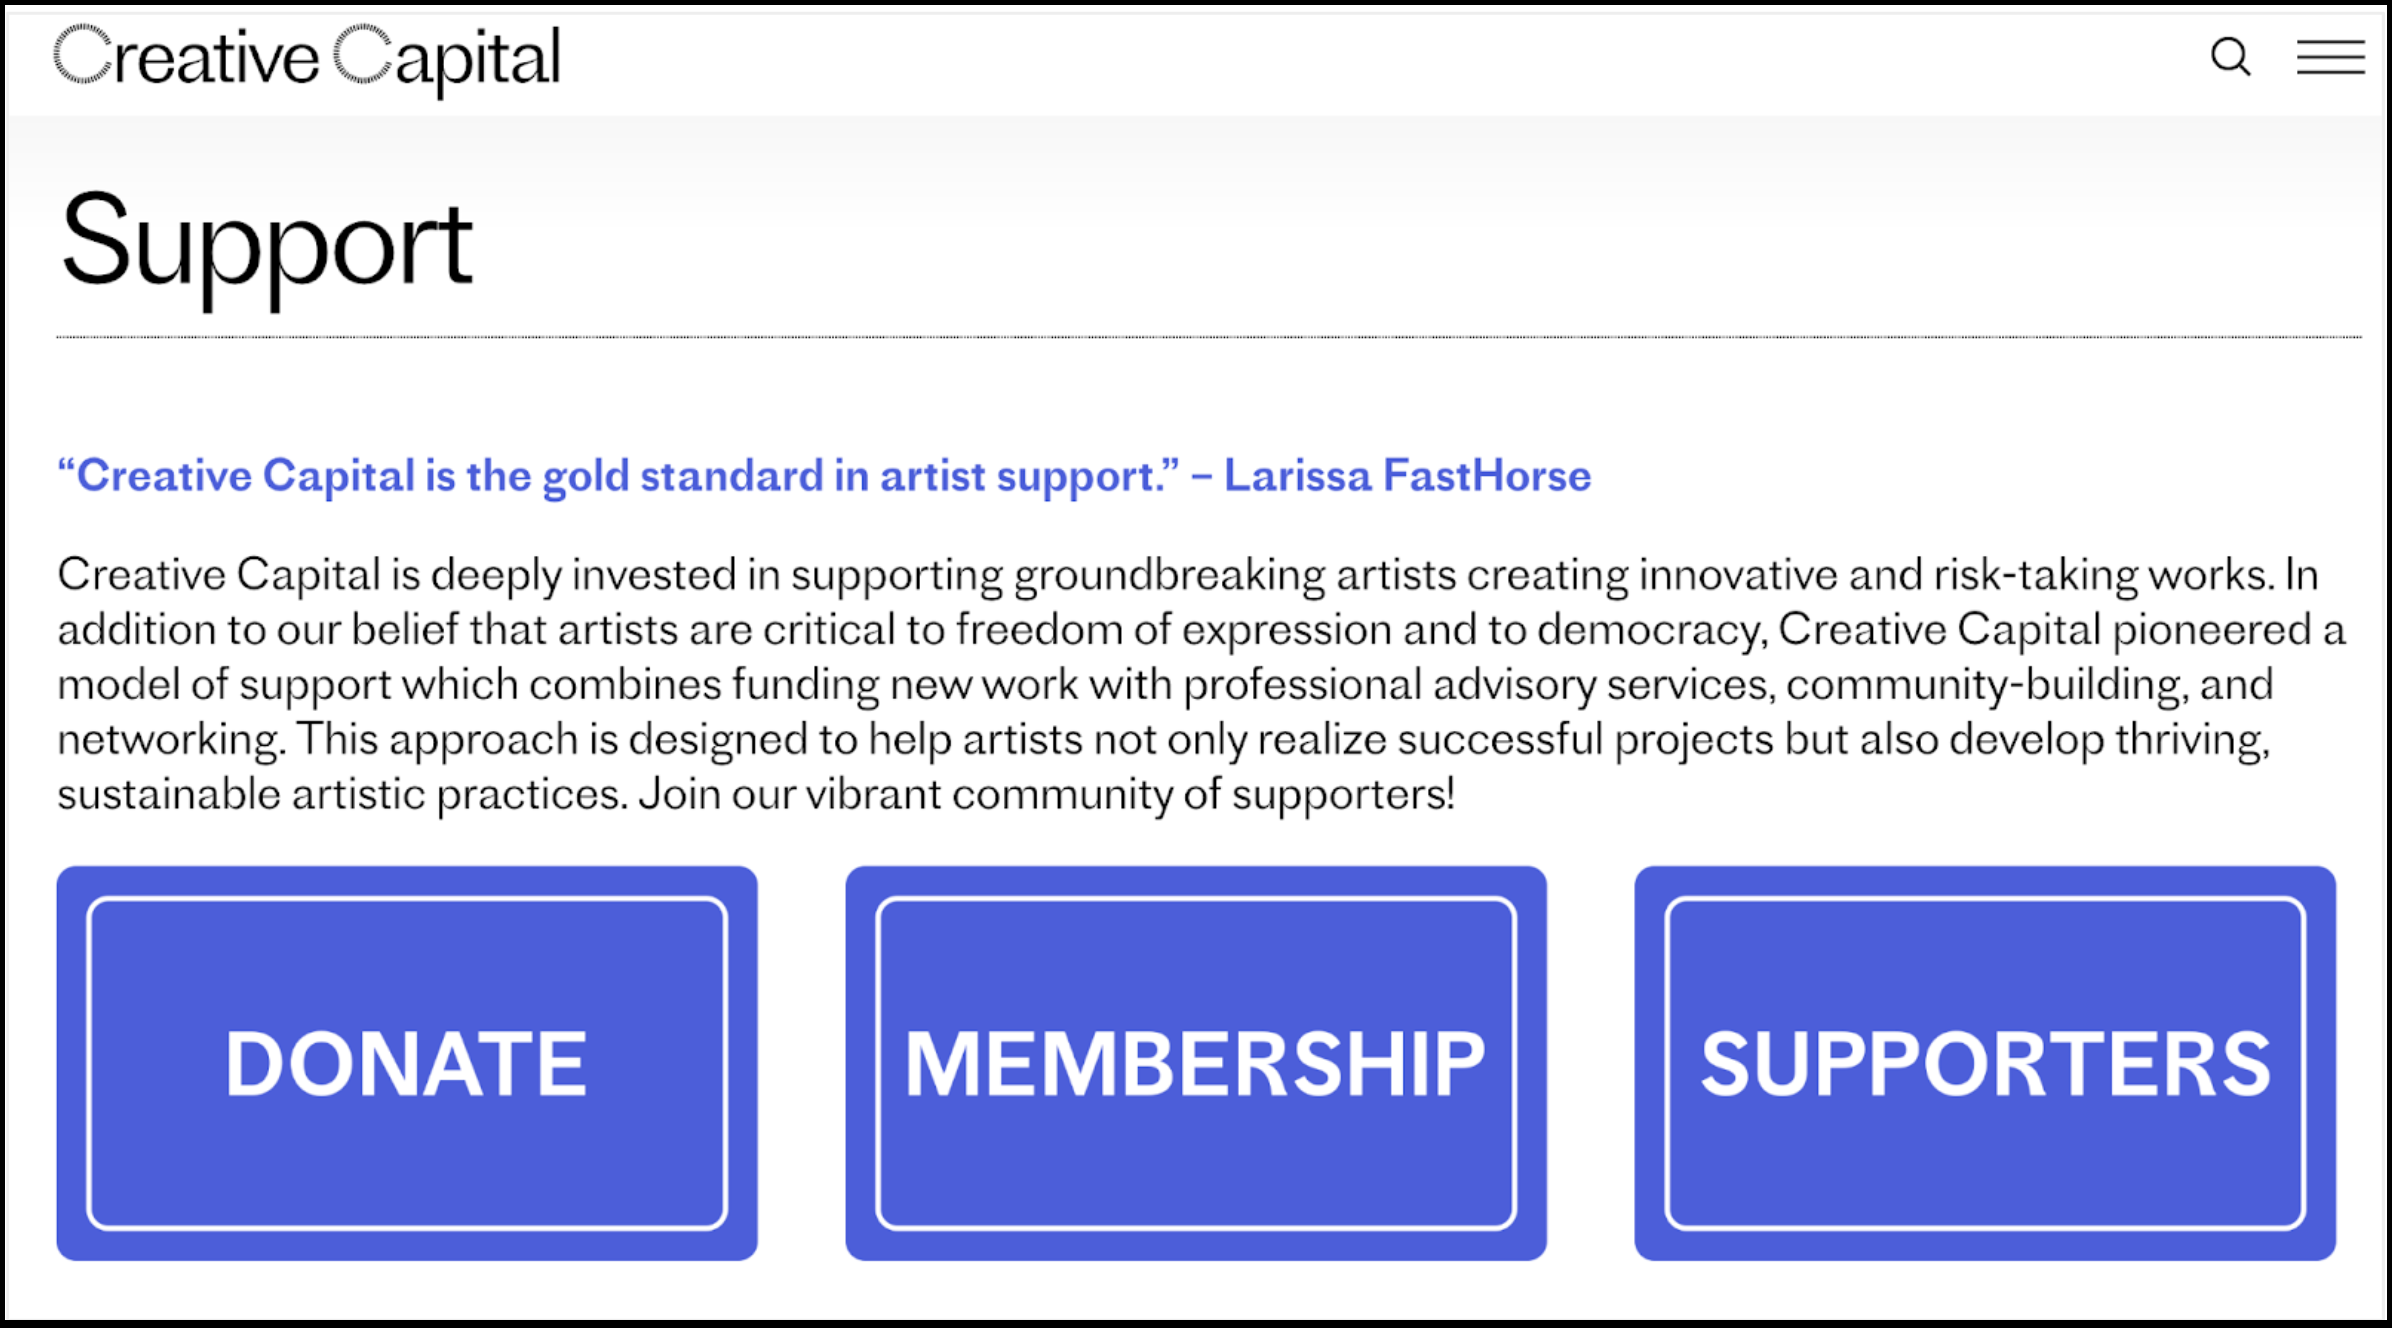
Creative Capital’s Support Page
Finding 3
Donate page lacks impact metrics and visible social media share button
Recommendations: Show social media share option by default and unify pages for Donate, Membership, and Support
Recommendation 1
Highlight the social media share button
We suggest considering the integration of social sharing buttons on the donation page to enhance the donor experience, increase engagement, and support. We can follow Art21's example, providing straightforward social media sharing options for donors to share their contributions and promote Creative Capital. Adjusting the visibility of these buttons may expand our reach to potential donors.
Recommendation 2
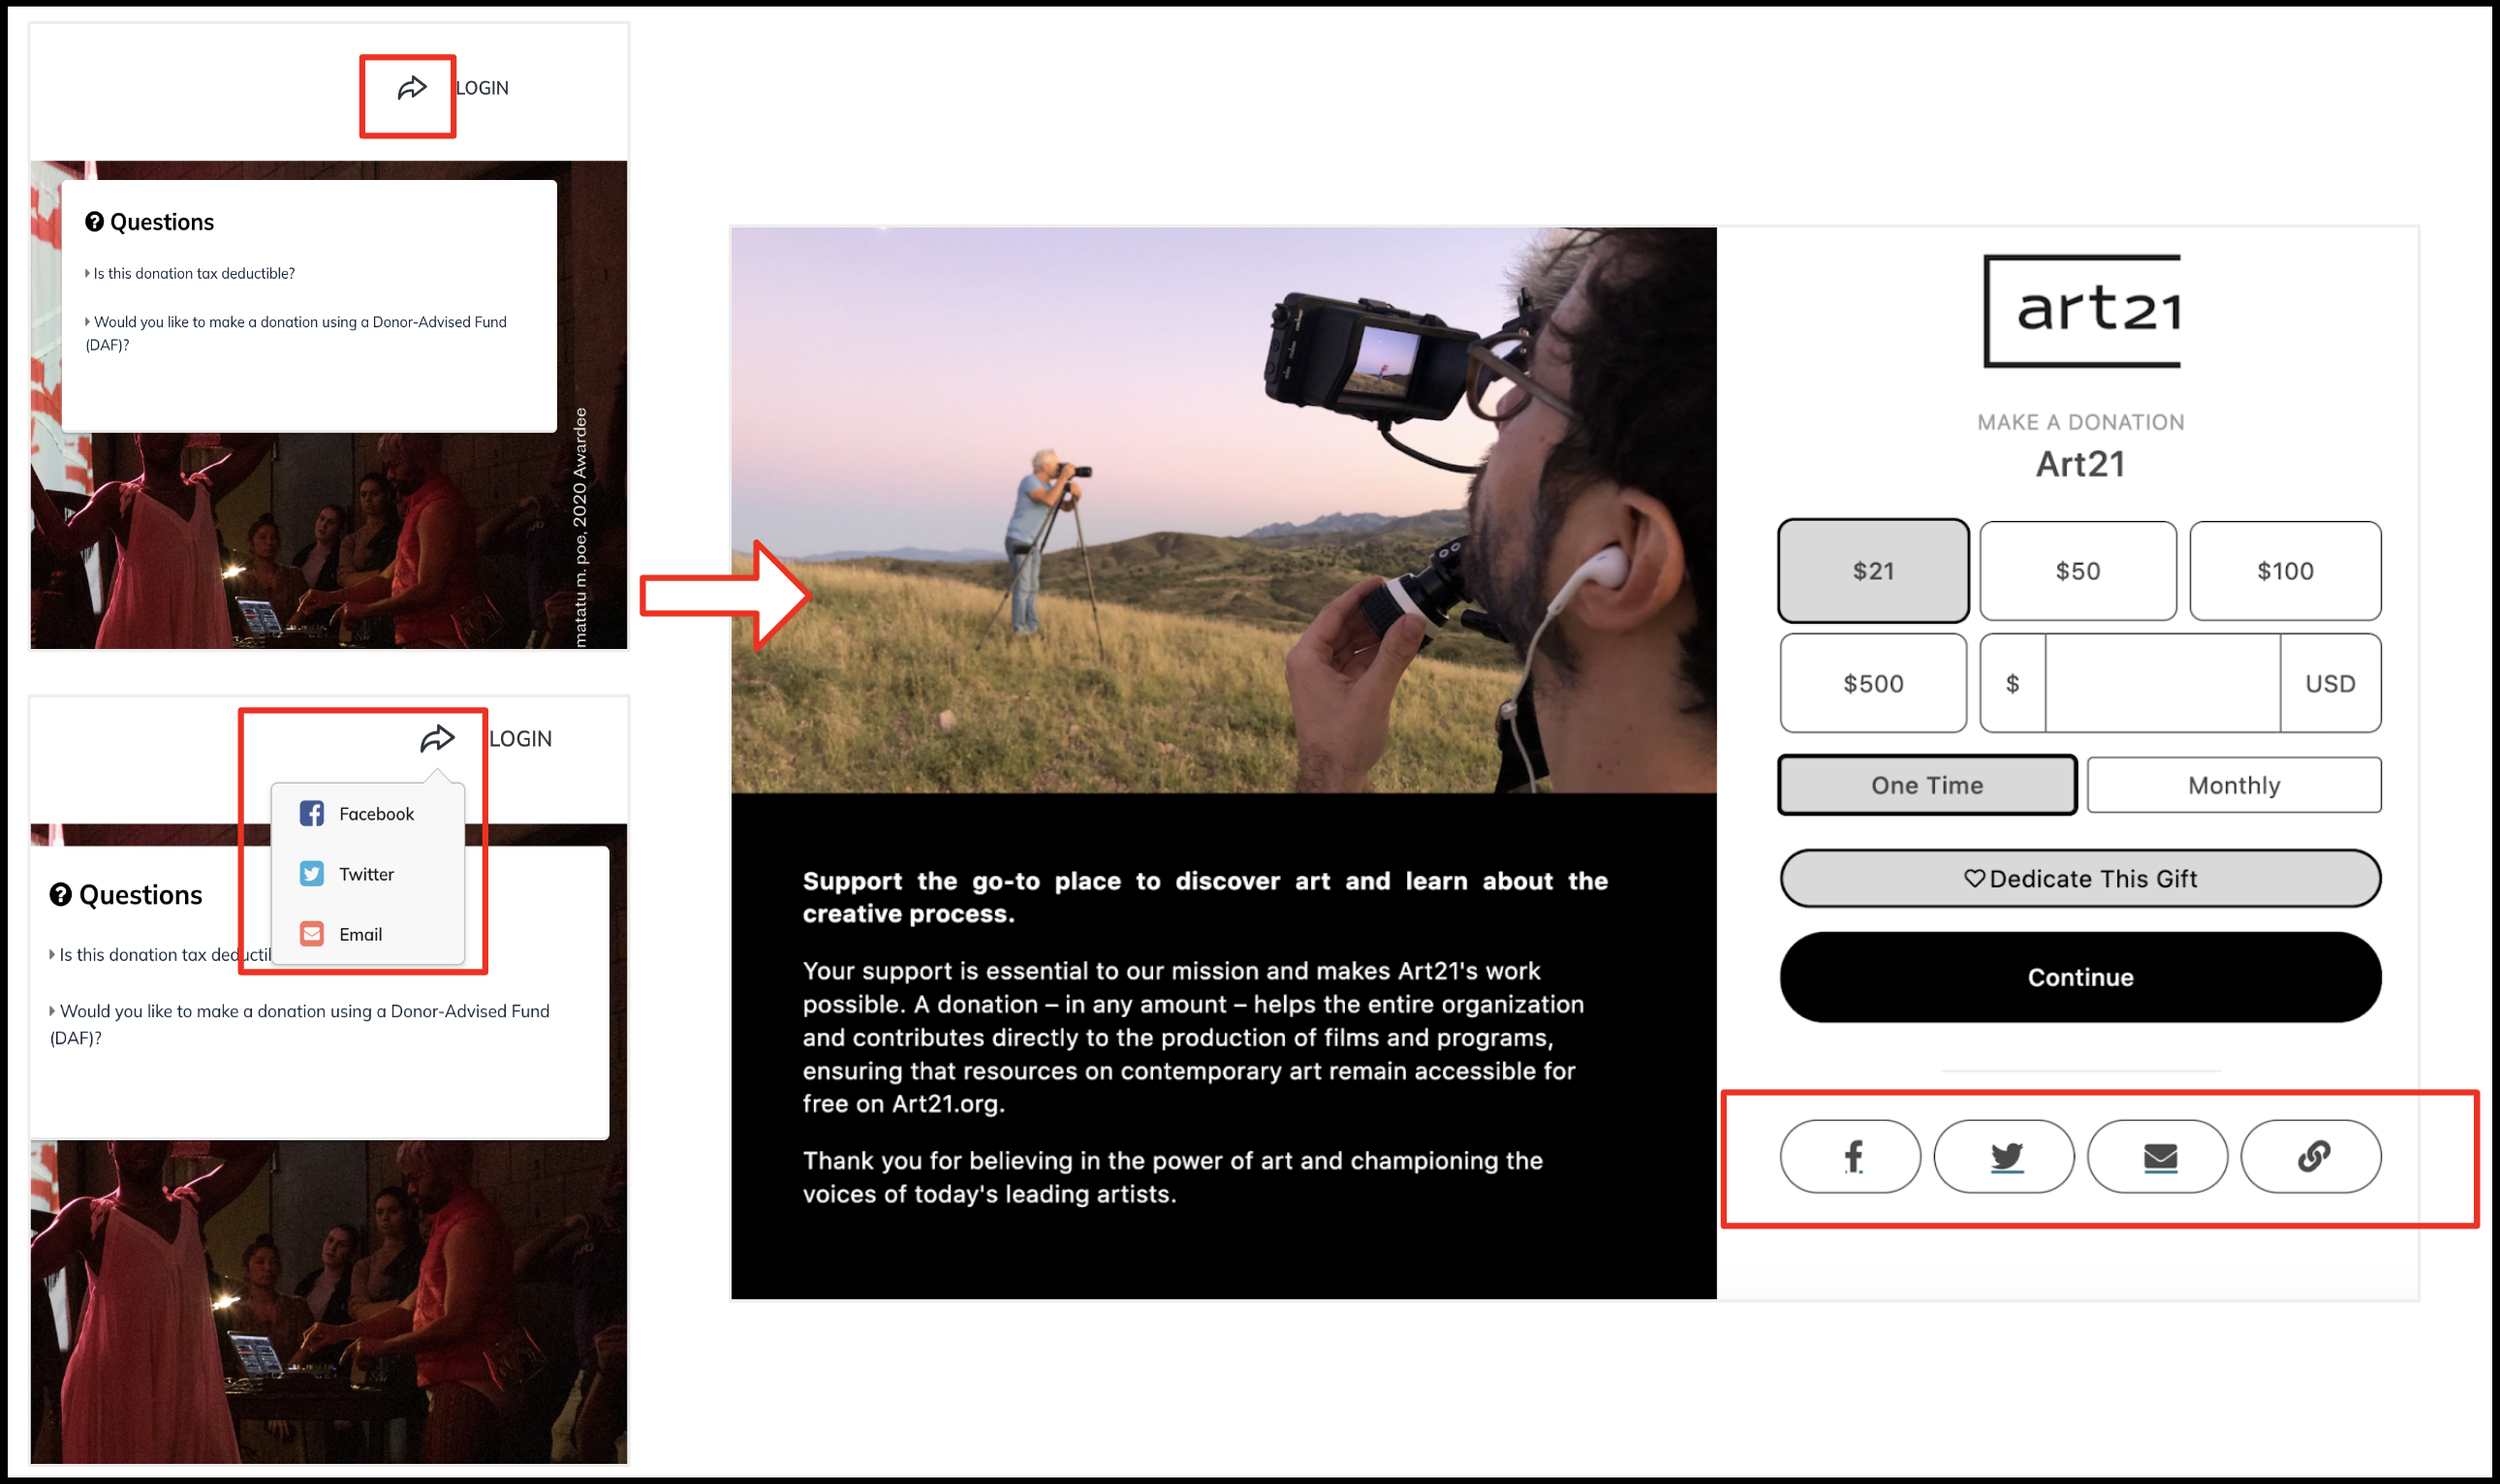
Current Donation sharing options
Eg. of Art 21’s Donate Page with visible sharing options
Unify the separate Supporters and Membership pages into Donate page
Following the Center for Book Arts' homepage, Creative Capital could prominently display the Donate page in the website banner to enhance visibility and encourage contributions.
We suggest consolidating Creative Capital's Donate, Memberships, and Supporters pages for a streamlined navigation experience and comprehensive support information.
Implementing personalized giving levels and benefits, similar to the Center for Book Arts’s Legacy Giving and Support Our Instructors options, could incentivize higher-level donations.
Center for Book Arts’s homepage
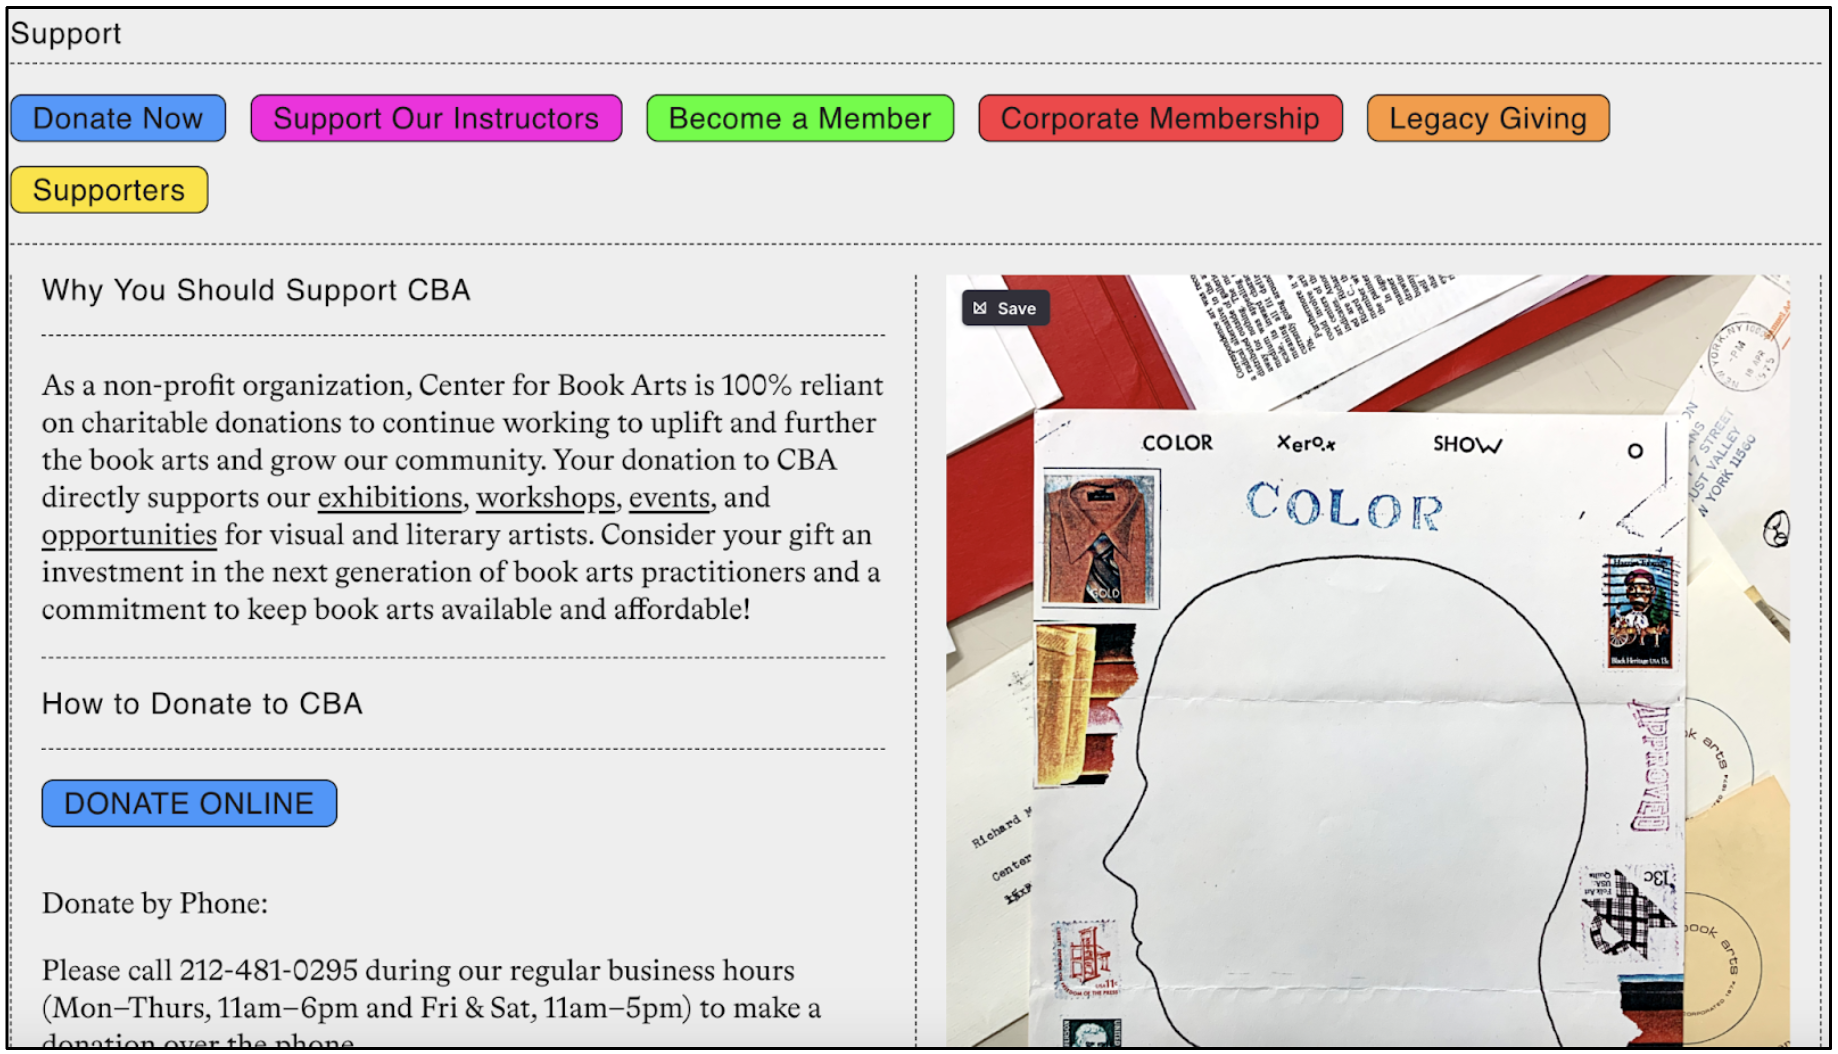
Center for Book Arts Support Page
In April 2022, Creative Capital's Instagram engagement was 66% higher than the average engagement between March 2022 and March 2023. Several key metrics such as: engagement rate, like count, comments count, total reel interactions, carousel album engagement and media reach were high as compared to other months
The use of visually engaging content and relevant Earth Day hashtags significantly boosted engagement rates on Creative Capital's Instagram in April 2022. Videos and carousel albums, offering immersive experiences, proved most effective. This heightened engagement was consistent with other Earth Day-related posts shared that month.
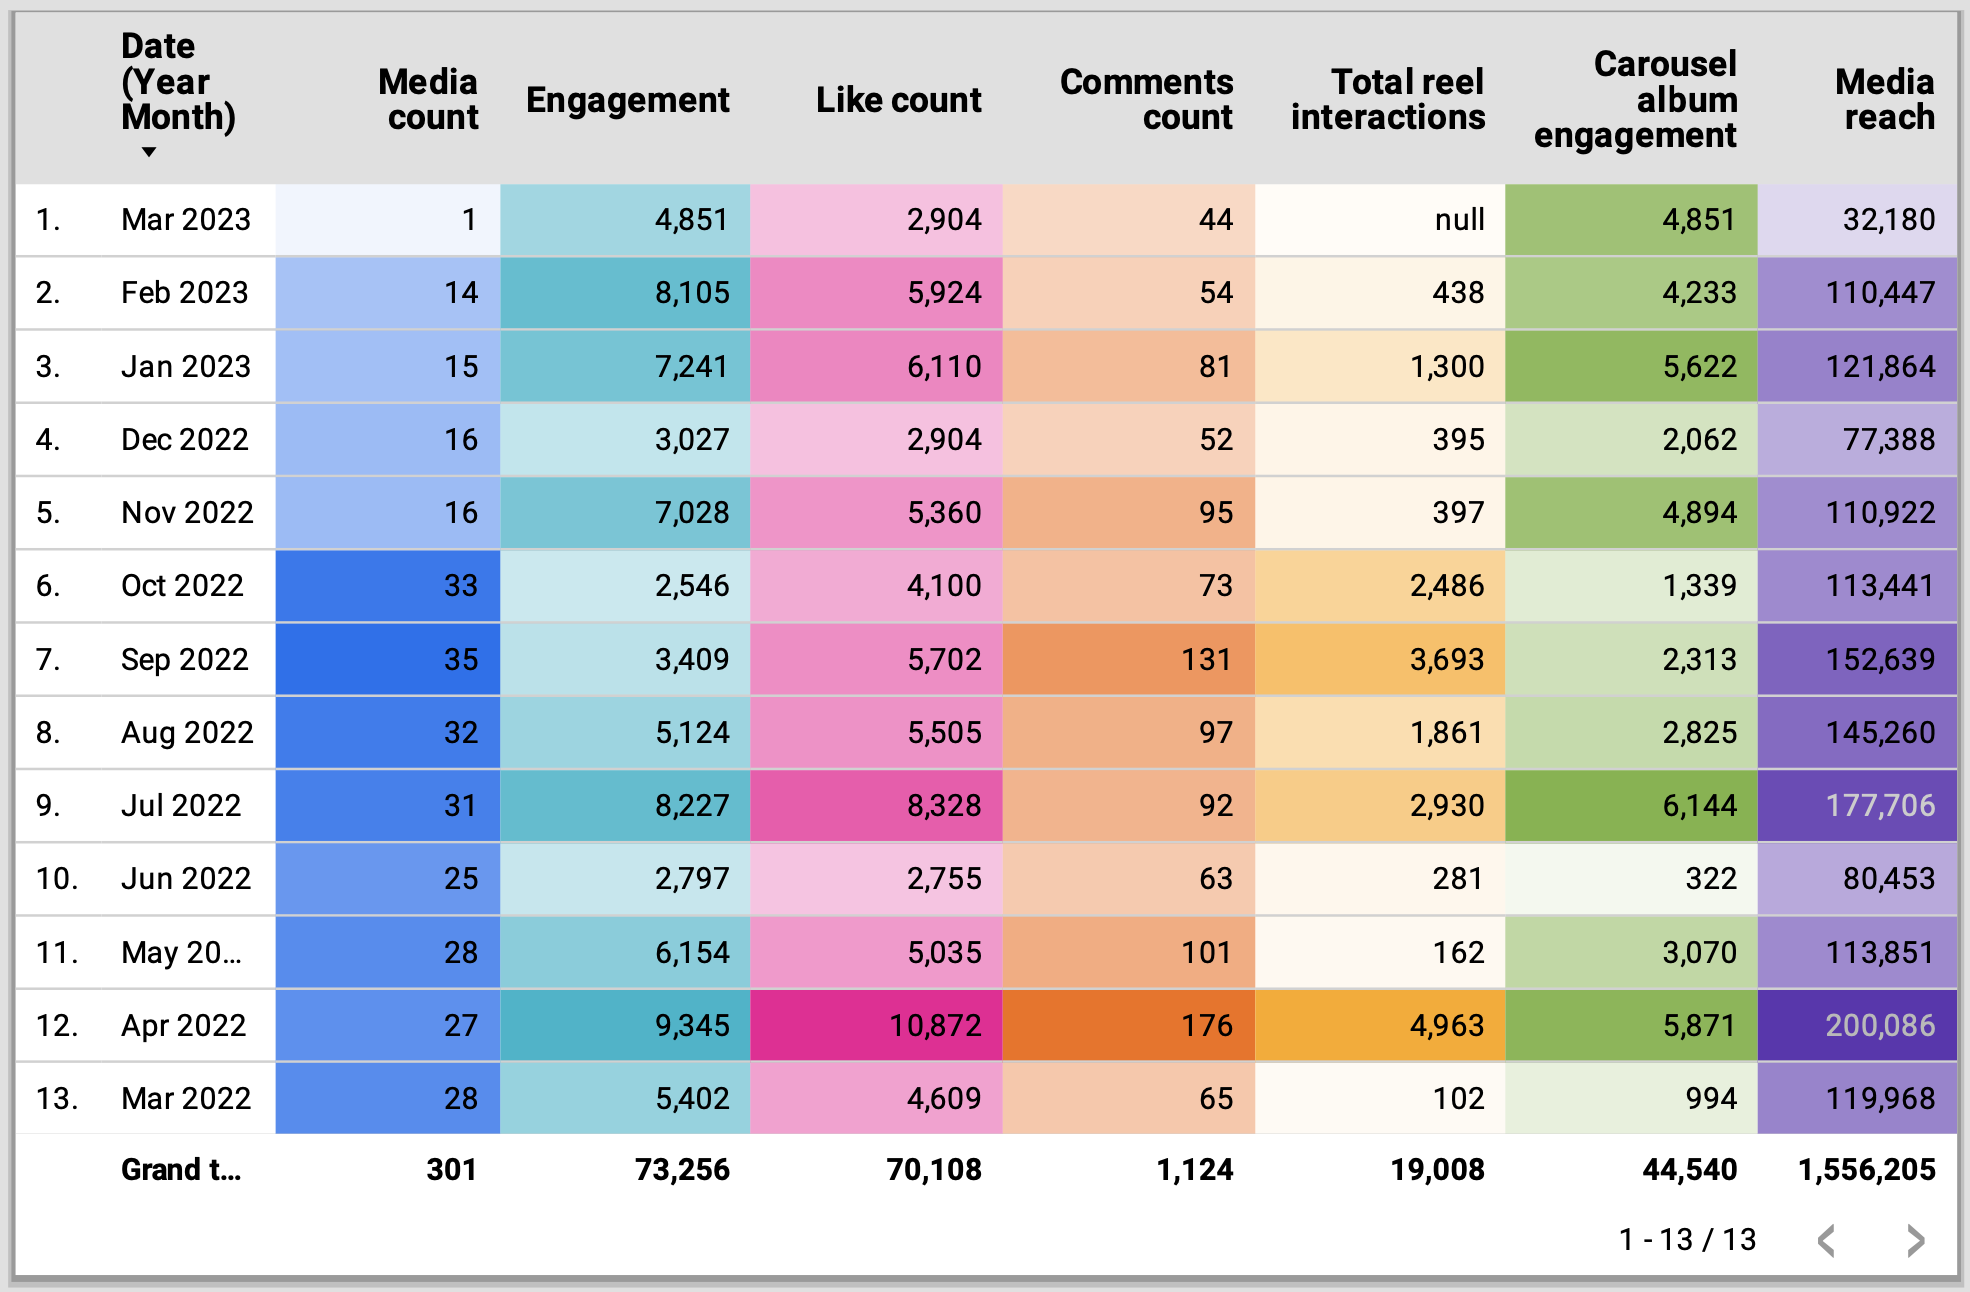
IG Engagement data from 1st Mar ‘22 - Mar ‘23
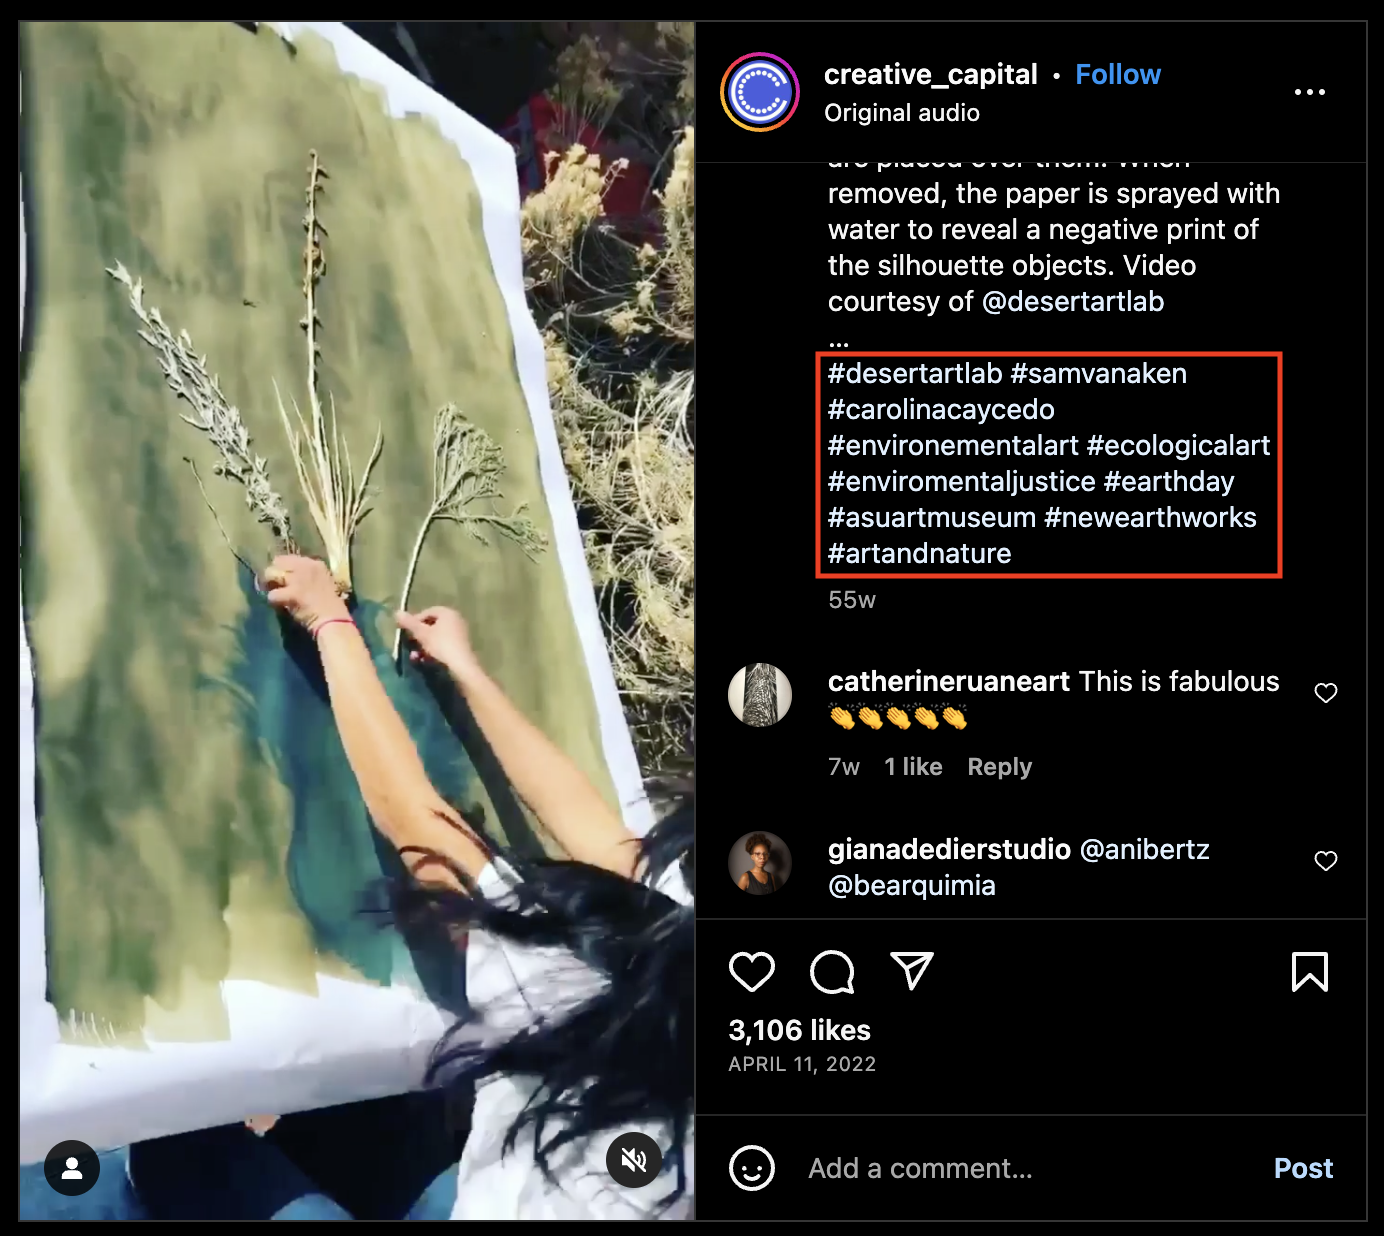
Post with the highest engagement in terms of likes, comments and save from April 11th ‘22
Instagram Findings
Finding 4
Instagram engagement surged in April 2022 due to Videos, carousels, & themed posts
Recommendation: Strategies for Dynamic Content, Timely Themes, & Data-Driven Insights
Based on our analysis of Creative Capital's Instagram engagement, we recommend:
Incorporating visually engaging content and relevant hashtags related to environmental challenges and using relevant hashtags like #environmentalart, #earthday, and #artandnature to attract viewers interested in environmental art and related topics.
Continue using videos and carousel albums, as they are successful formats for providing dynamic and immersive experiences for viewers.
Improving captions to be more concise and attention-grabbing.
Capitalizing on timely themes like Earth Day and other relevant events to drive higher engagement rates.
Regularly analyzing Instagram metrics and adjusting content strategy accordingly.
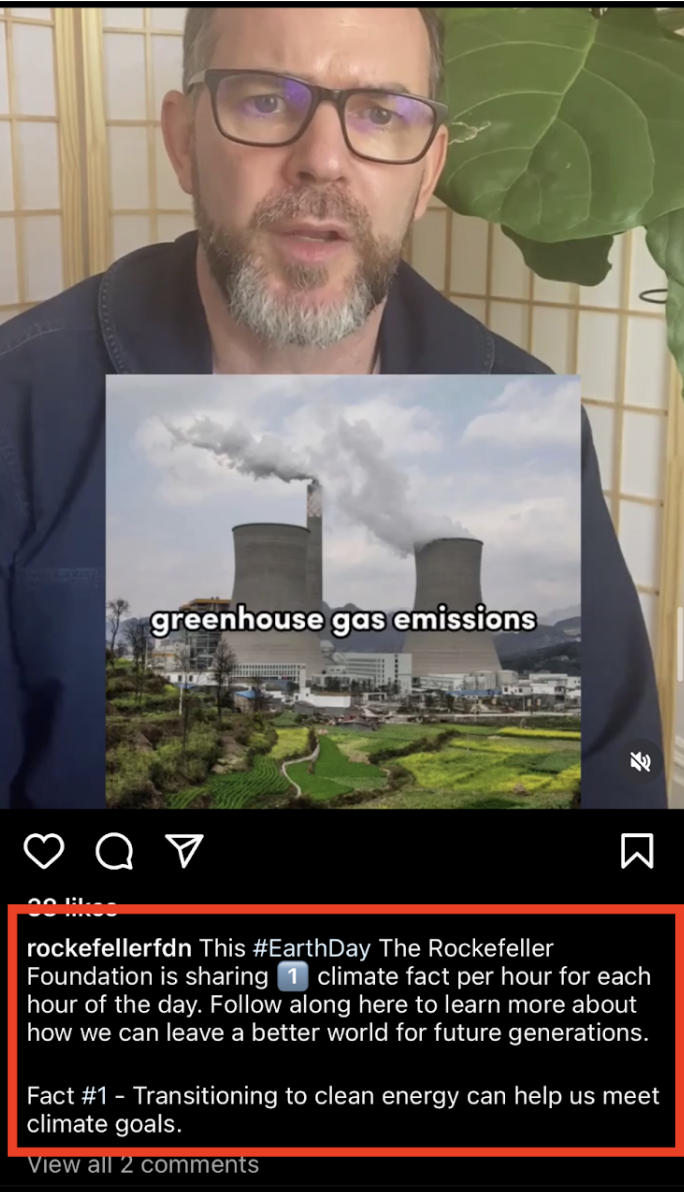
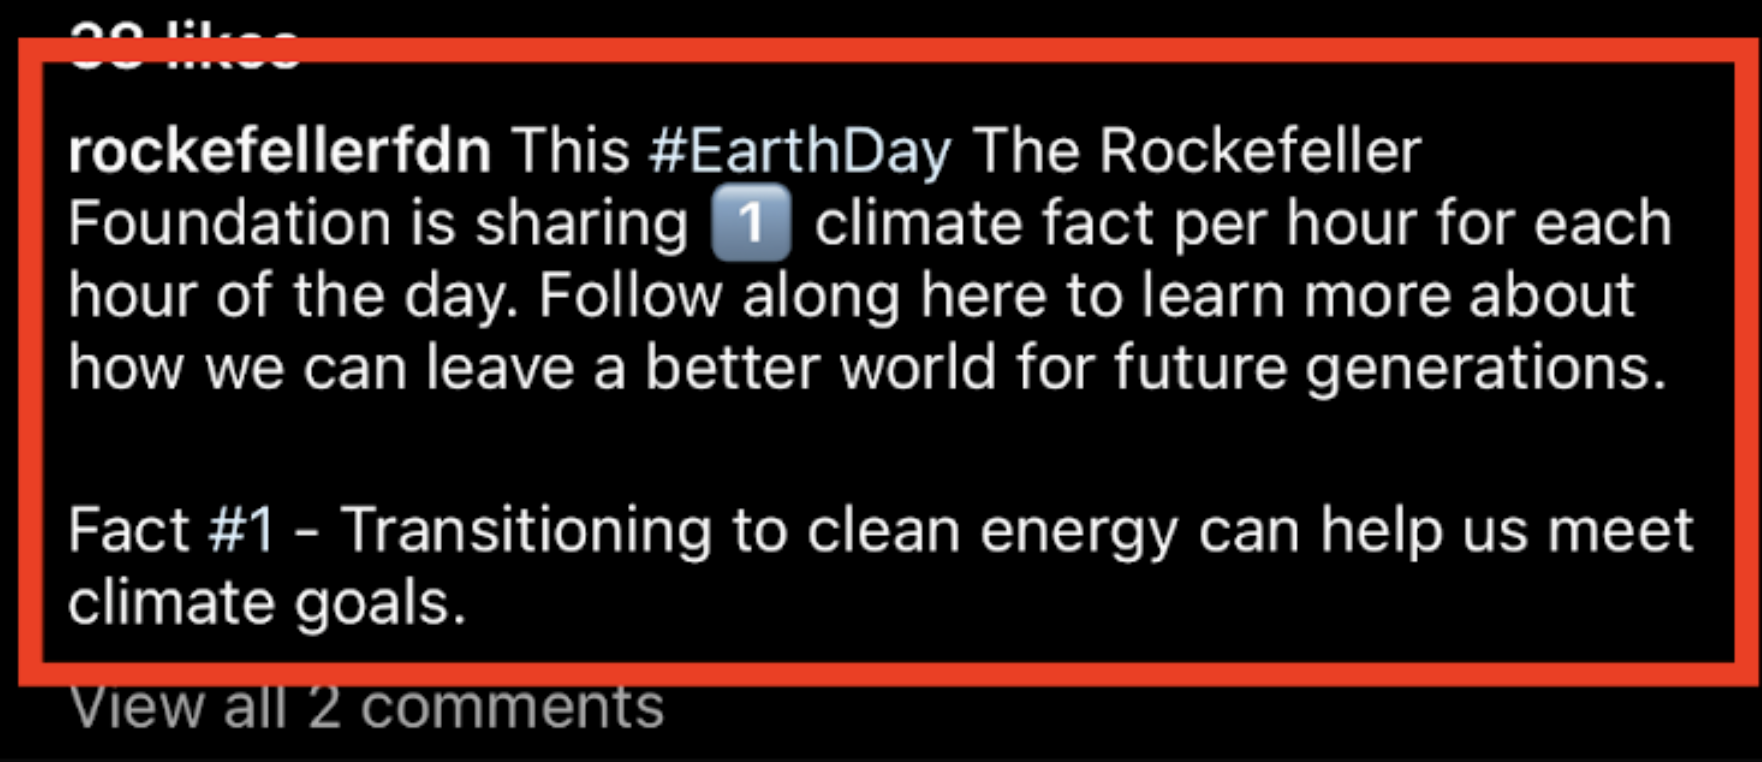
Eg. how other nonprofit org. use concise captions
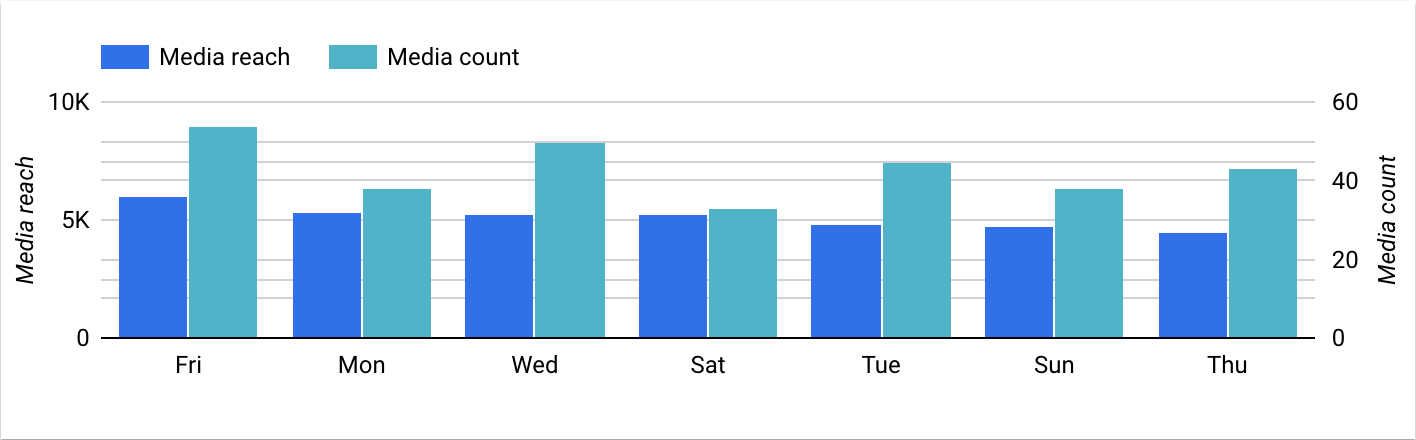
IG metrics analyzing: For eg. Friday - highest number of videos posted and the highest reach
These recommendations could help Creative Capital to grow their IG engagement & reach a wider audience.
Conclusion: From Study to Success
To sum it all up, our digital analytics project with Creative Capital was a resounding success! We presented our report, slide deck, and dashboard to the client, and they were absolutely thrilled with our work. Our team provided valuable insights and recommendations to boost Creative Capital's digital presence. We worked with various tools to enhance their website, track user journeys, and optimize their social media content.
Our client, Aliza, was highly impressed with the Looker studio dashboards we delivered, and we went the extra mile by adding profile follower count growth rates and offering guidance on Super-metrics and Looker's studio.
While we encountered a few challenges during our analysis, we were transparent with Aliza, explaining the limitations and providing solutions. We also encouraged her to stay vigilant with Instagram and Google analytics, refining their content strategy and seizing timely trends.
In essence, I’m confident that our project has laid a solid foundation for Creative Capital to expand its audience and boost engagement. With a mix of digital analytics tools and strategic recommendations, we're excited to support Creative Capital in its mission to empower artists and nurture sustainable artistic careers. Here's to a bright future!
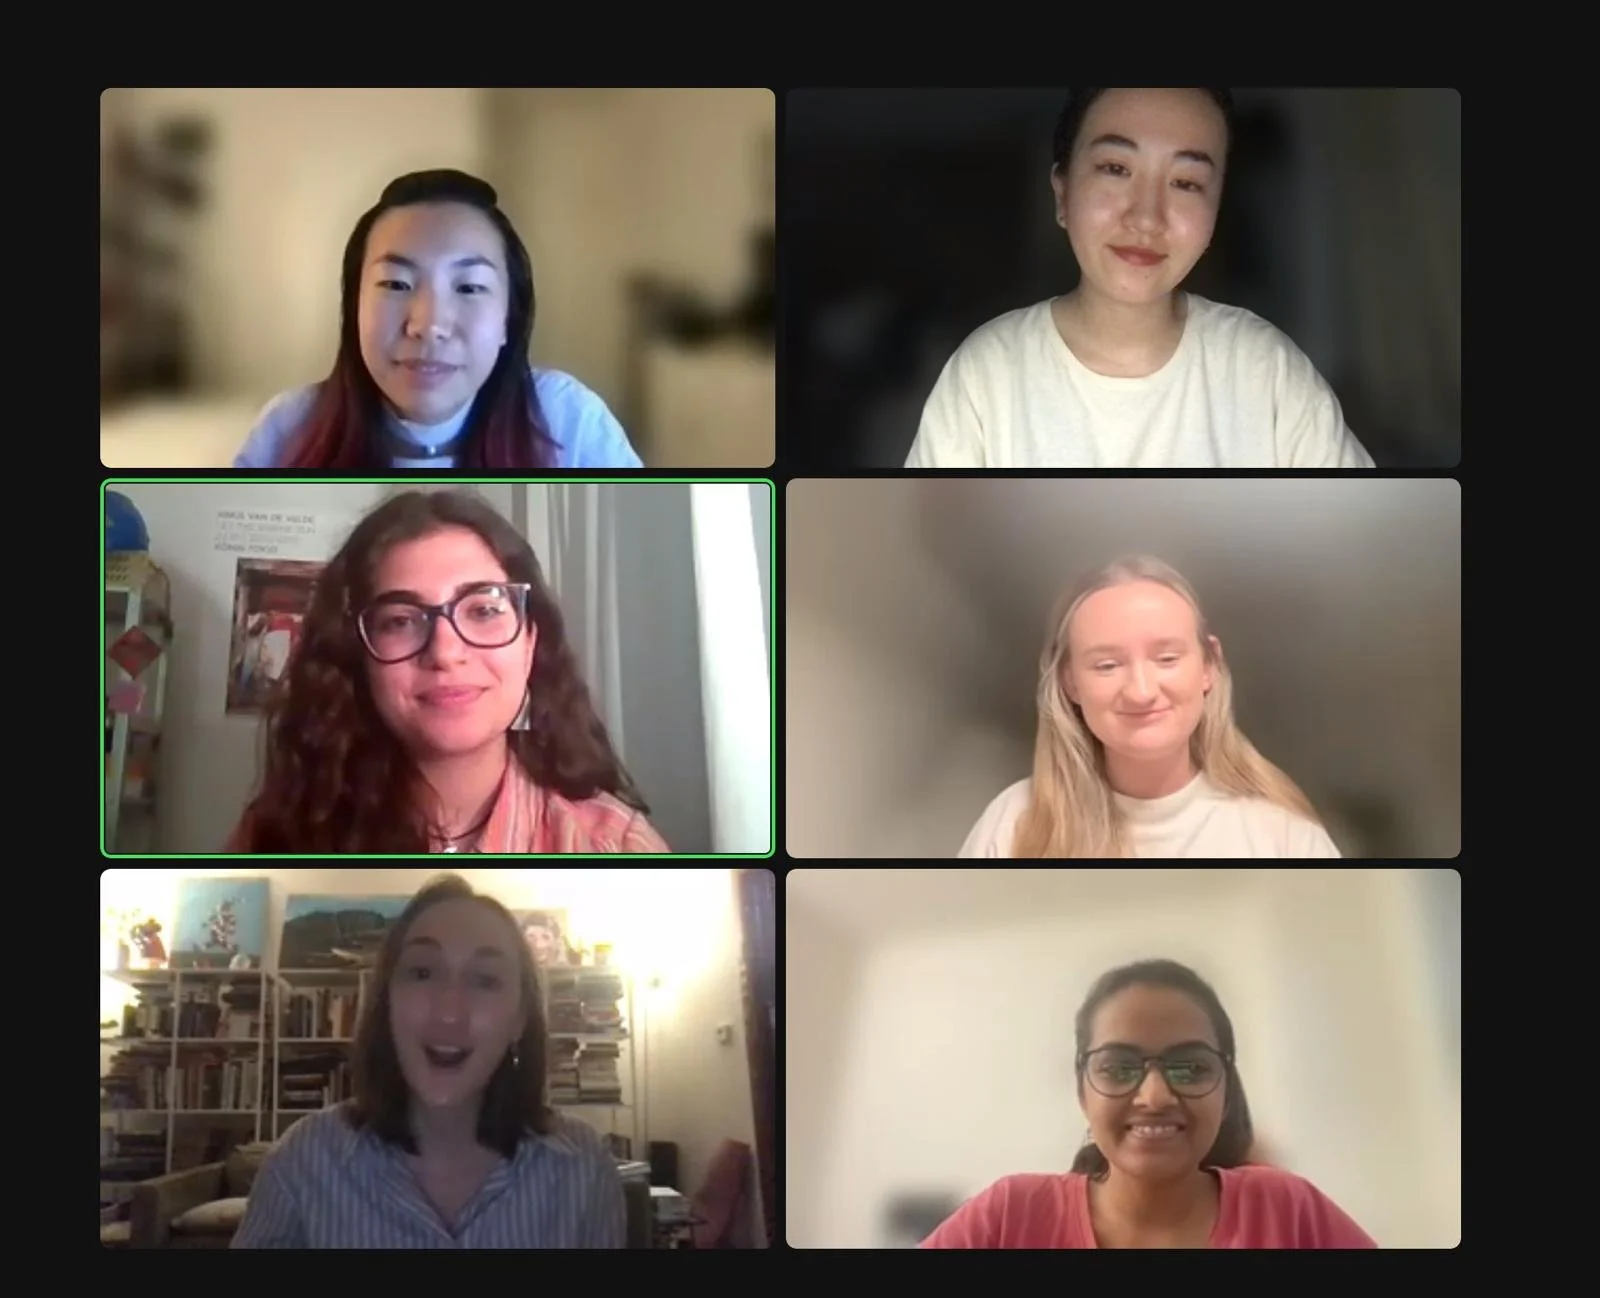
Client presentation on Zoom with my team
Given more time, we'd love to further implement our recommendations and dive deeper into Instagram metrics for even more valuable insights.